
Figure 7:
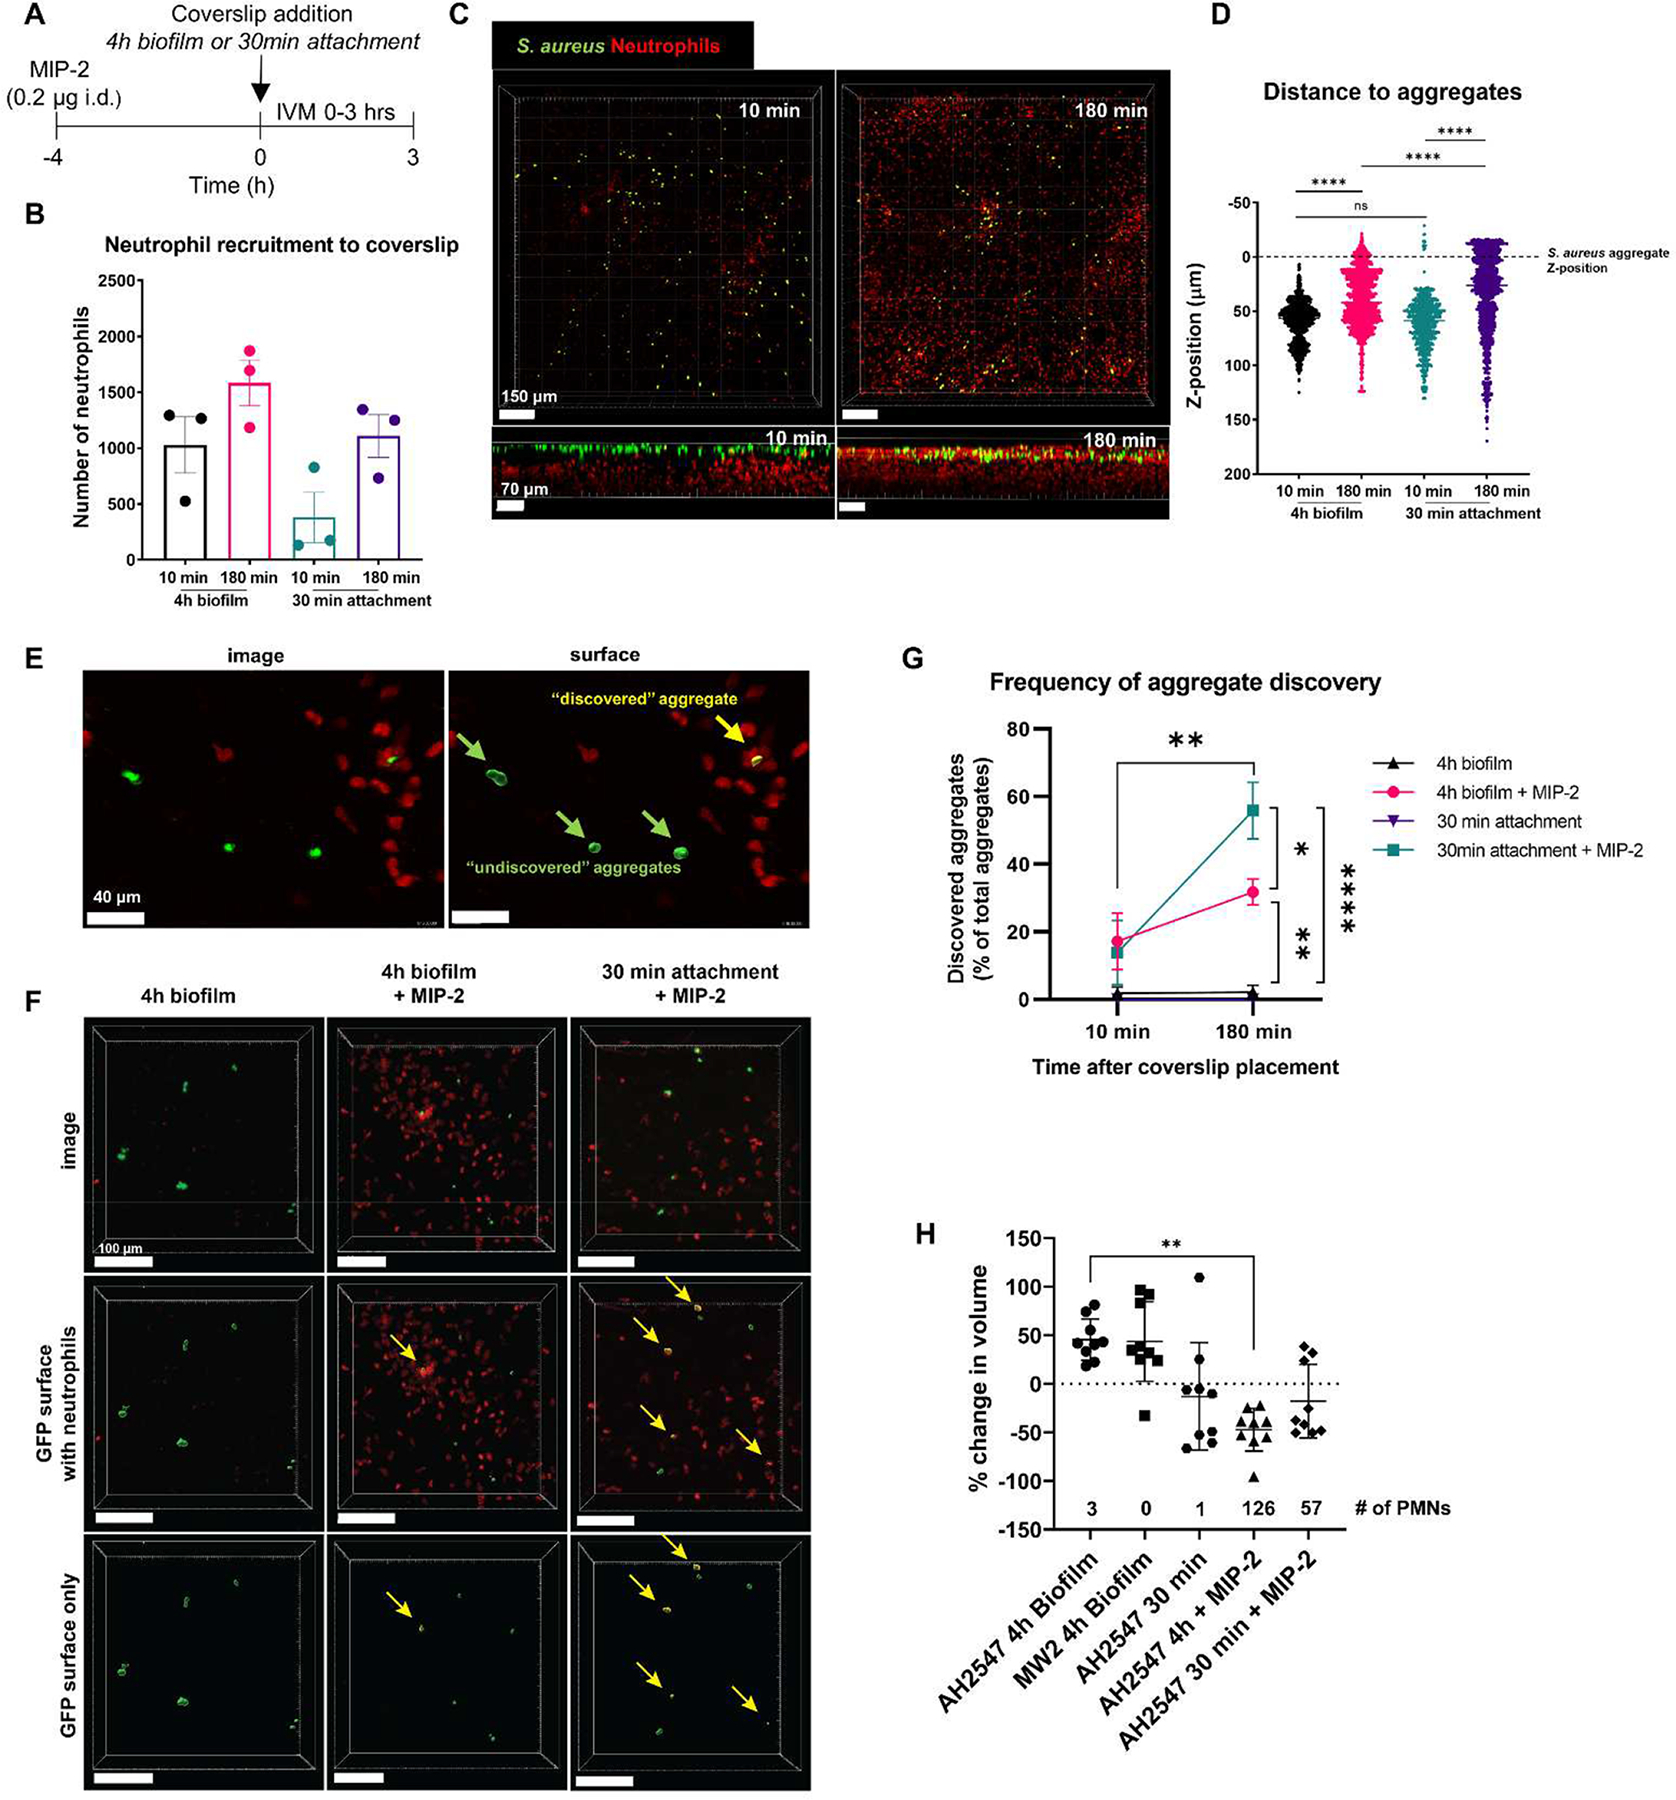
Pre-recruitment of neutrophils to the skin results in S. aureus aggregate discovery and increased clearance. (A) Experimental timeline for MIP-2 treatment and intravital microscopy. (B) Quantification of neutrophil recruitment at 10 min and 180 min after coverslip placement. Error bars indicate the mean ± SEM (n=3/condition, one-way ANOVA with Tukey’s post-hoc test). (C) Representative 3D stitched image showing neutrophil migration through the z-plane towards S. aureus on the coverslip at 10 min and 180 min after coverslip placement. Top panels show XY plane viewed from the top (scale bars = 150 μm), bottom panels show XZ plane viewed from the side (scale bars = 70 μm). (D) Quantification of neutrophil distance to S. aureus aggregates. Z-position was normalized to the averaged Z-position of S. aureus aggregates at each time point. Dashed line indicates the average z-position of S. aureus aggregates. Each dot represents one neutrophil. Data are mean ± SEM (n=3 mice/condition, one-way ANOVA p<0.0001, Tukey’s post hoc test **** p<0.0001). (E) Representative image showing one bacterial aggregate discovered by neutrophils and three other bacterial aggregates that remain undiscovered. Left: intravital image, right: surface reconstruction with a filter applied to label the discovered bacteria aggregate (yellow) and undiscovered aggregates (green). Scale bars = 40 μm. (F) Representative intravital images of aggregate discovery. Left: 4 h biofilm with no MIP-2 treatment. Middle: 4 h biofilm with MIP-2 treatment. Right: 30 min attachment with MIP-2 treatment. Yellow arrows point to discovered aggregates. Scale bars = 100 μm. (G) Quantification of aggregate discovery across the three conditions: 4 h biofilm, 4 h biofilm + MIP-2, 30 min attachment + MIP-2. Data show discovered aggregates as a percent of total aggregates at select time points 10 min and 180 min after coverslip placement. Data are mean ± SEM (n=3 mice/condition, Two-way RM ANOVA p<0.01, Tukey’s post hoc test *p<0.05, **p<0.01, **** p<0.0001 compared between groups at the indicated time point, Bonferroni’s multiple comparisons test **p<0.01 compared over time within the same group). (H) Percent change in GFP volume between the last frame and first frame for the final continuous FOV for each position. Numbers above the x-axis indicate the average number of neutrophils in the FOV at the end of imaging. Data mean ± SD (Each data point indicates one FOV, n=3 mice/condition, Kruskal-Wallis Test *p<0.05, ***p<0.001).