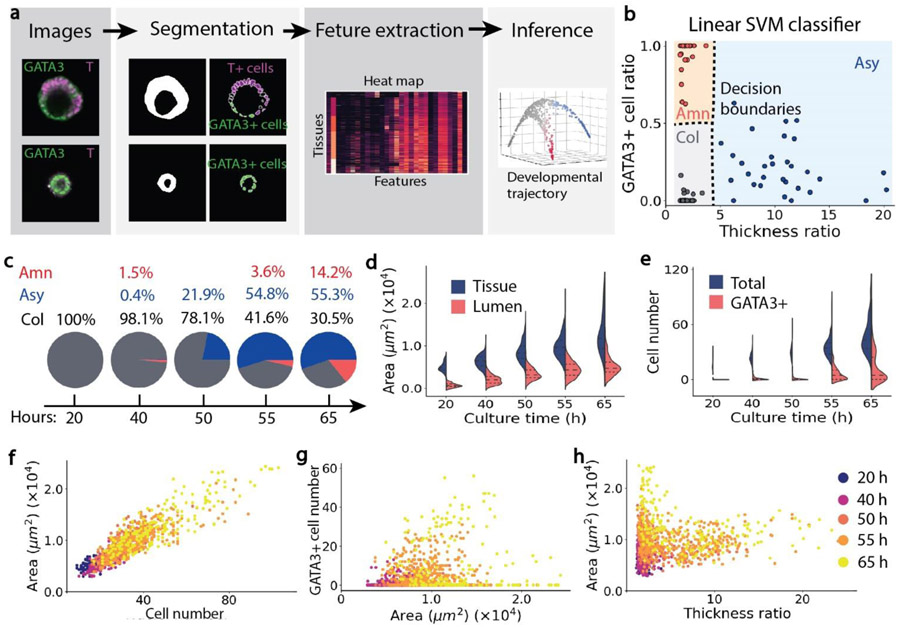
Figure 2. Properties of tissues grown from an intermediate cell seeding density (n = 1166).
a, Schematics of image-based tissue profiling, which includes segmentation and feature extraction, and unsupervised trajectory inference. b, Linear multi-class SVM classifier for automatically distinguishing columnar (col), amniotic-like (amn) and asymmetric (asy) tissues. Dashed lines represent decision boundaries. c, Percentages of three types of tissues over time. d, Tissue and lumen area over culture time. e, Total cell number and GATA3+ cell number over culture time. f, Tissue area plotted against the number of cells contained in each tissue. g, Number of GATA3+ cells plotted against tissue area. h, Tissue area plotted against tissue thickness ratio. Color-coding in f-h denotes culture time of tissues.

