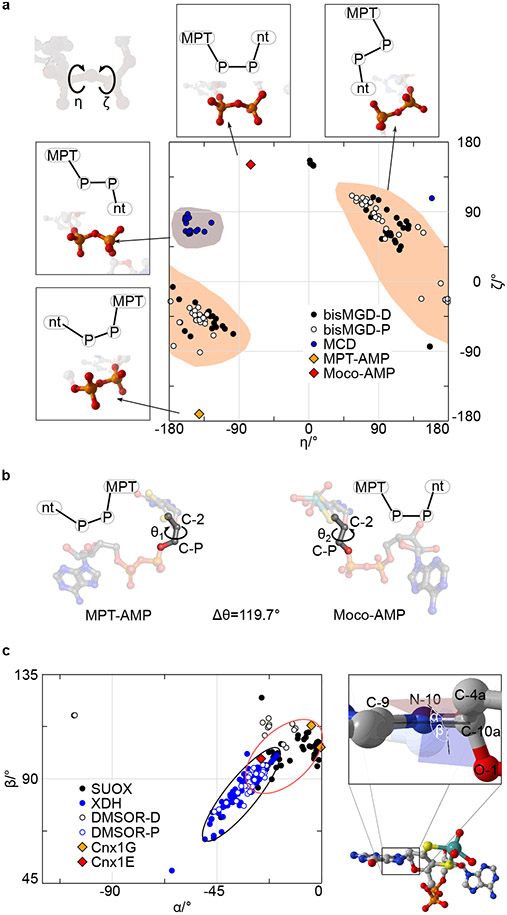
Figure 3: Moco-AMP dihedrals.
(A) A plot of ζ (Pπ–OB–P5’–O5’) vs η (Oπ–Pπ–OB–P5’) for Moco-AMP and the bis-MGD, MCD, and MPT-AMP structures in the Protein Data Bank. The most common regions are highlighted for bis-MGD and MCD. The schematic drawings indicate the orientations of MPT and the second nucleotide relative to each other. (B) Reorientation of MPT-AMP during transition from Cnx1G to Cnx1E. (C) Phosphoric acid anhydride dihedrals found in molybdopterin dinucleotides. A plot of α (C9–N10–C10a–C4a) vs β (C9–N10–C10a–O1) for Moco-AMP and other Moco structures found in the Protein Data Bank. The black and red ellipses indicate the favored regions for pyranopterins in members of the xanthine dehydrogenase and the sulfite oxidase family, respectively.

