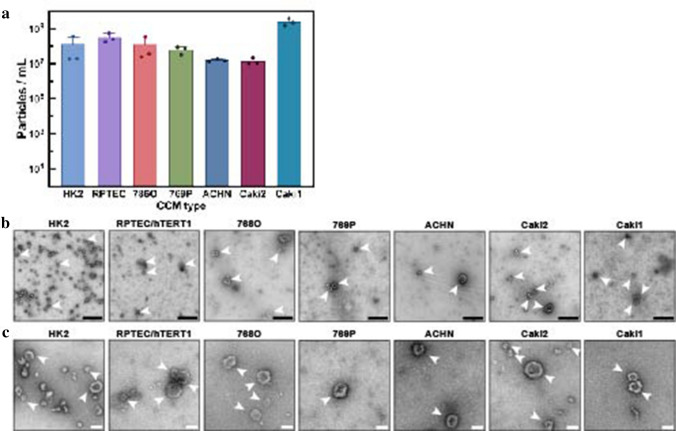
Fig. 1.
EV characterization by NanoFCM and TEM. a Total particle concentrations by cell number at moment of CCM harvest demonstrate number of secreted EVs per million cells. Mean + SD were calculated of three replicates. b TEM images confirm the presence of negative-stained EVs, seen as cup-shaped vesicles in widefield view. Black scale bar represents 500 nm. White arrows indicate small EVs. c close-up TEM images of kidney EVs. White scale bar represents 100 nm. White arrows indicate small EVs

