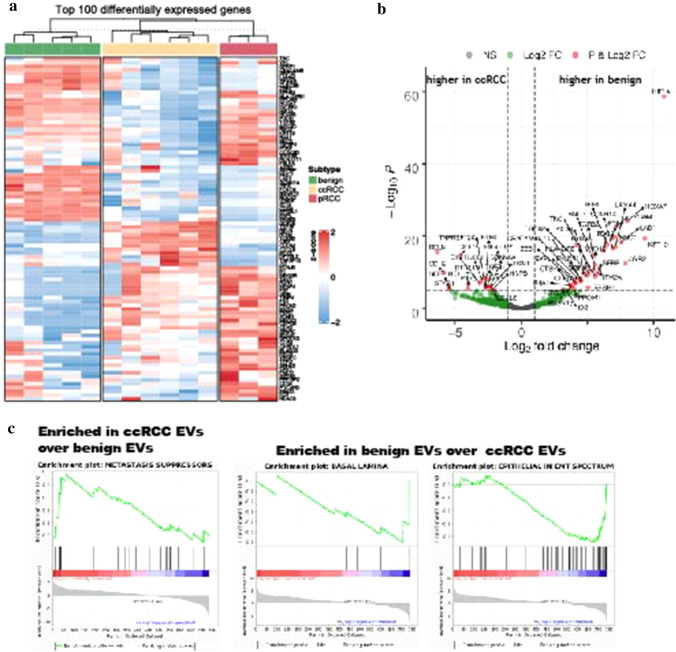
Fig. 3.
Comparison of the mRNA abundance in benign kidney EVs, ccRCC EVs, and pRCC EVs. Heatmap of top 100 differentially expressed genes using unsupervised clustering demonstrates unique expression patterns for EVs from each subtype (benign, ccRCC, and pRCC). Upregulated genes are in red and downregulated in blue. c. Volcano plots demonstrating fold changes of differential gene expression between ccRCC EVs and benign kidney EVs (Data are reported as x-axis = log2 fold change, y-axis = p value, dashed lines represent p-value cutoffs of 10e−6, 10e−8, and 10e−5). d GSEA plots of Nanostring gene sets enriched in ccRCC or benign EVs (Significance determined as p < 0.05. FDR < 0.25)

