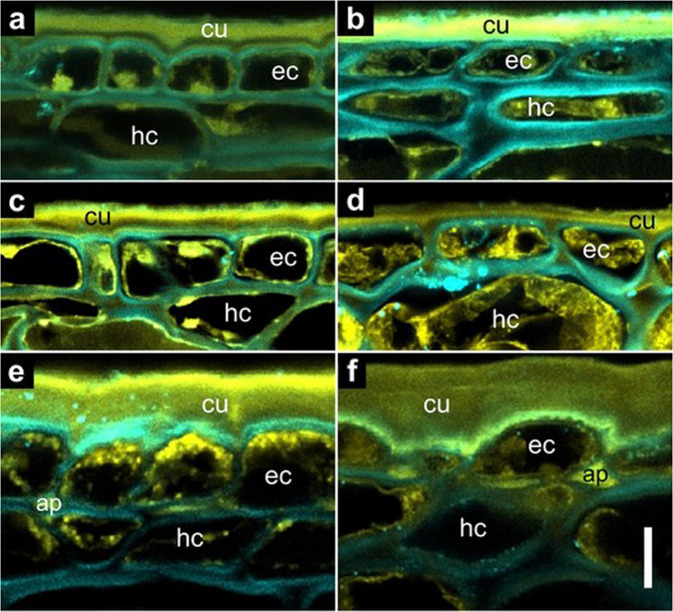
Fig. 1. Confocal laser scanning micrographs of grape berry skin tissues.
a ‘Merlot’ green hard berry. b ‘Merlot’ overripe berry. c ‘Zinfandel’ green hard berry. d ‘Zinfandel’ overripe berry. e ‘Concord’ green hard berry. f ‘Concord’ overripe berry. The autofluorescence (501–549 nm) from phenolic compounds was visualized by yellow false color. The fluorescence (422–464 nm) from cell walls due to the Calcofluor white staining of cellulose was visualized by blue false color. Overlapping blue and yellow signals are responsible for the greenish appearance of some structures. The letters indicate cuticle (cu), epidermal cells (ec), hypodermal cells (hc), and anticlinal pegs (ap). The vertical scale bar represents 10 µm

