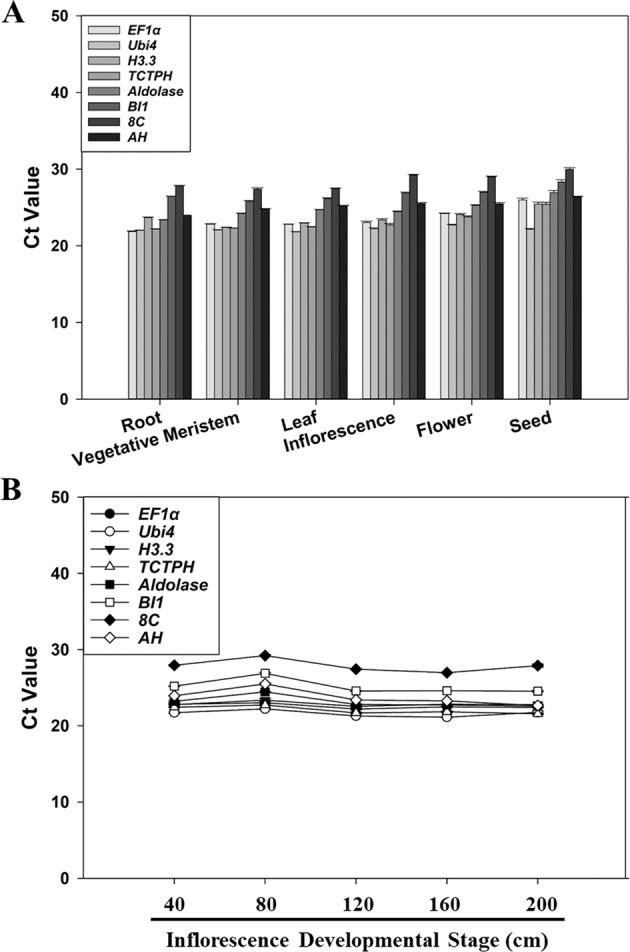
Fig. 2. Transcript abundance of the eight candidate reference genes in different tissues (A) and at different inflorescence developmental stages (B) of T. ravennae measured by qPCR.

RNA was extracted from the root, vegetative meristem, leaf, inflorescence, flower, and immature seed, and from the developmental stages of the inflorescence of 40, 80, 120, 160, and 200 cm in length. Ct values indicate the mean values of transcript abundance from three independent replicates ± standard errors (vertical bars)
