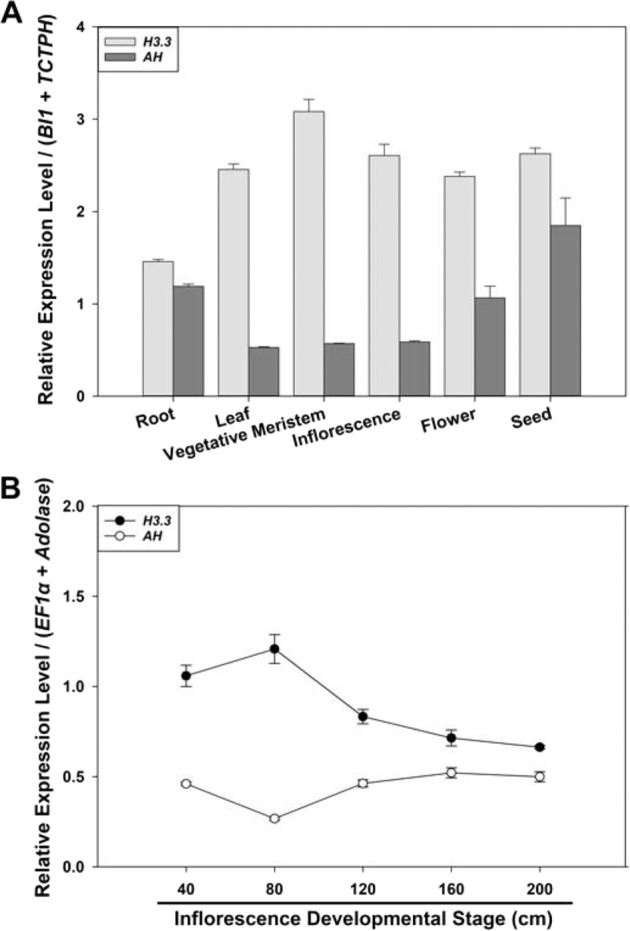
Fig. 6. Relative expression levels of H3.3 and AH in different tissues (A) and at various inflorescence developmental stages (B) of T. ravennae measured by qPCR.

The two best reference genes BI1 and TCTPH in different tissues (A) and EF1α and Aldolase at various inflorescence developmental stages (B) were used as the reference genes. Data analysis was conducted using the 2−ΔΔCt method. Relative expression levels indicate the mean values of three independent replicates ± standard errors (vertical bars)
