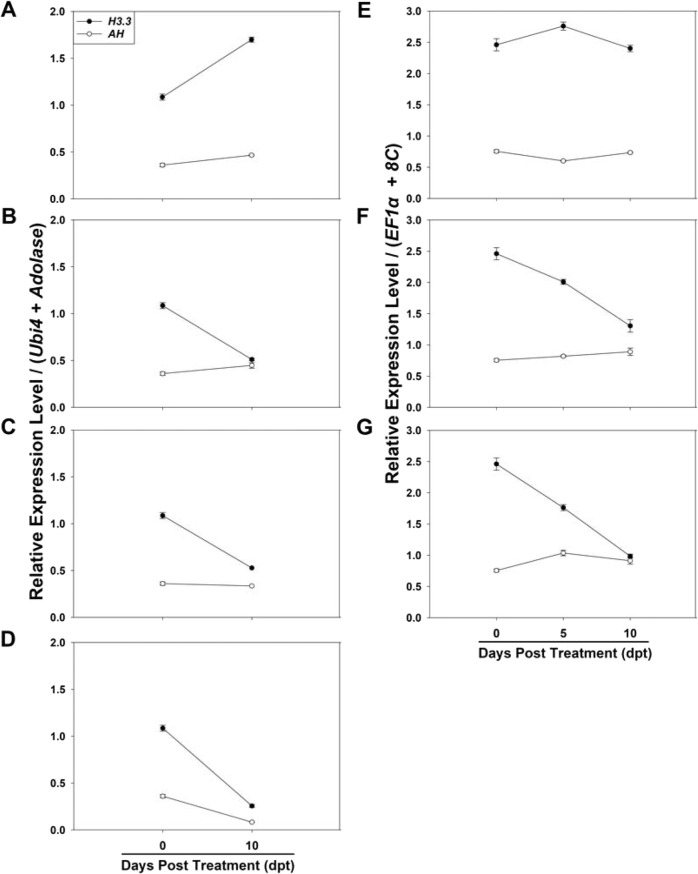
Fig. 7. Relative expression levels of H3.3 and AH in T. ravennae under salinity stress (A–D) and water-deficit stress (E–G) measured by qPCR.
The two best reference genes Ubi4 and Aldolase under salinity stress (A–D) and EF1α and 8C under water-deficit stress (E–G) were used as the reference genes. Data analysis was conducted using the 2−ΔΔCt method. Relative expression levels indicate the mean values of three independent replicates ± standard errors (vertical bars)

