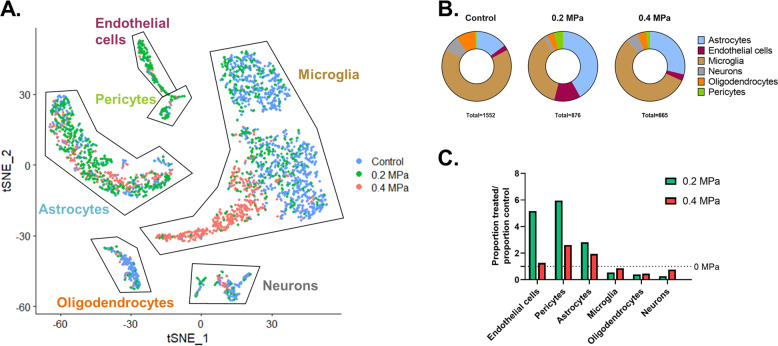
Fig. 2. Identification of FUS-transfected cell types as a function of PNP.
A t-SNE plot showing all sequenced cells, colored according to their treatment condition. Labels on the graph indicate cell populations identified by graph-based clustering followed by the analysis of globally distinguishing transcripts within each cluster. B Proportions of each of the six identified cell types for each condition. The total numbers of cells analyzed are shown below each chart. C Bar graph illustrating the influence of FUS PNP on the distribution of transfected cells (color figure online).

