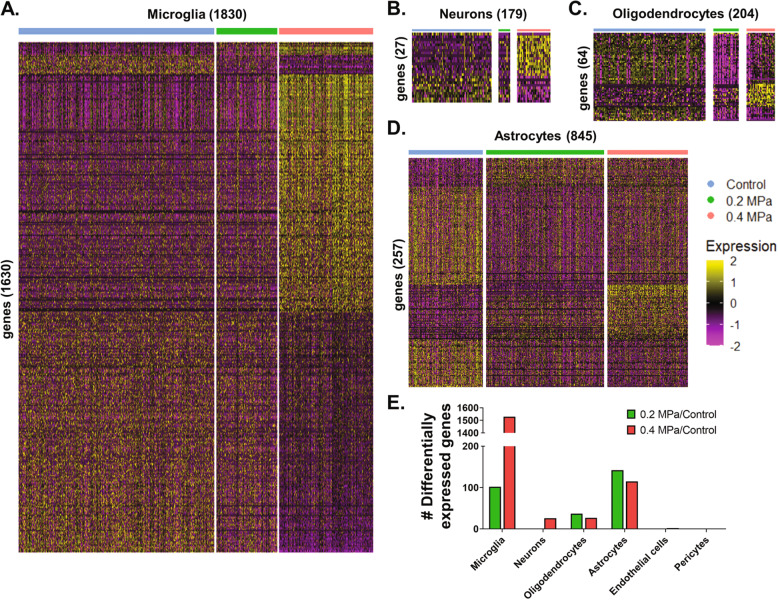
Fig. 3. Transcriptional responses of individual-focused ultrasound-transfected cells.
A–D Gene expression heatmaps for (A) microglia, (B) neurons, (C) oligodendrocytes, and (D) astrocytes. Each column represents a single-cell and each row represents a gene of interest. Selected genes for each cell type are significantly (p-adjusted < 0.05) upregulated or downregulated at 0.2 MPa or 0.4 MPa compared to control. Expression levels are presented as row-normalized z-scores according to the key. Numbers in parenthesis indicate the total number of cells (columns) or genes (rows) presented. E Magnitude of significant (p adjusted < 0.05) differential gene expression (upregulated + downregulated) for each cell type at each pressure vs control cells.

