Fig. 4.

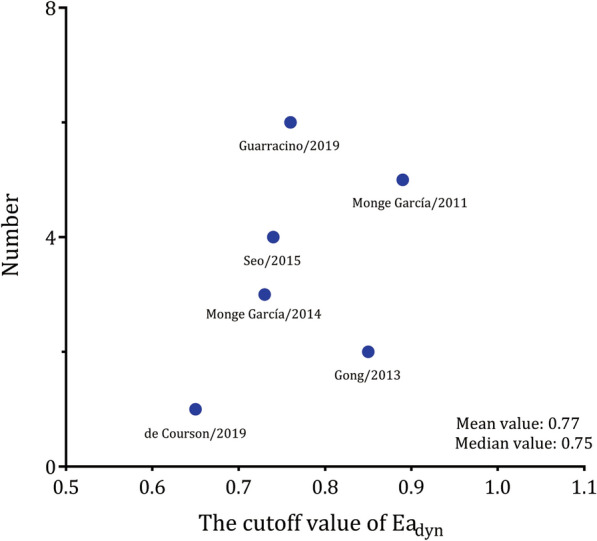
Scatter plot of the cut-off value of dynamic arterial elastance. The distribution was nearly conically symmetrical, most data were centred between 0.7 and 0.8, and the mean and median values were 0.77 and 0.75, respectively

Scatter plot of the cut-off value of dynamic arterial elastance. The distribution was nearly conically symmetrical, most data were centred between 0.7 and 0.8, and the mean and median values were 0.77 and 0.75, respectively