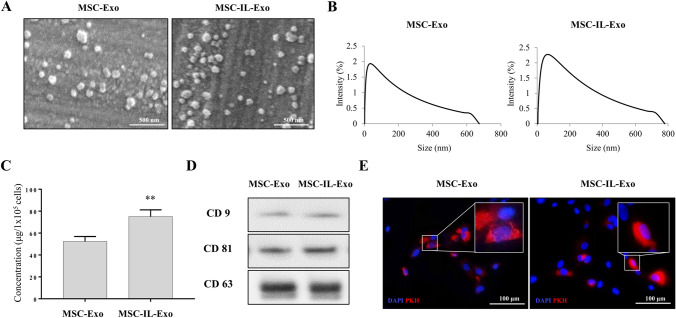
Fig. 1.
Characterization of exosomes derived from naive and IL-1β-primed MSCs. Exosomes were purified from the naive (MSC-Exo) or IL-1β-primed MSCs at 25 ng/mL for 24 h (MSC-IL-Exo) using ExoQuick-TC (Systems Biosciences). A Scanning electron microscope images of MSC-Exo and MSC-IL-Exo. Scale bar = 500 nm. B Size distribution of exosomes was analyzed by dynamic light scattering and presented as percent intensity in each group. C The amounts of MSC-Exo and MSC-IL-Exo were measured via Bradford assay. Values of 105 cells are presented as mean ± SD from three independent experiments (n = 3). **p < 0.01 by one-way ANOVA. D Protein levels of CD9, CD81, and CD63 in each exosome group were examined by Western blot analysis. E Exosomes labeled with PKH-26 were used to treat SW982 cells and visualized in red in the fluorescent images. DAPI staining for nucleus is shown in blue. Scale bar = 100 μm

