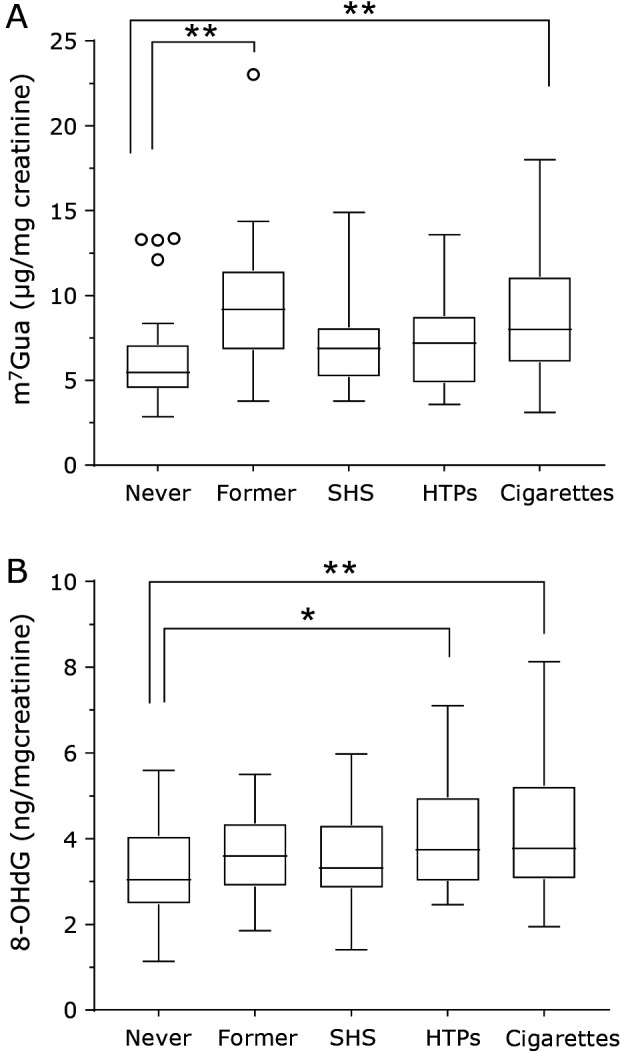
Fig. 3.

Tukey box plots of urinary DNA damage marker levels (A: m7Gua; B: 8-OHdG) for different smoking statuses. The horizontal lines within boxes indicate median levels. P values are based on the Kruskal-Wallis test followed by the post hoc Dunn’s test (m7Gua) or one-way ANOVA followed by Dunnett’s test (8-OHdG). Multiple comparisons of never smokers and each group. *p<0.05, **p<0.01.
