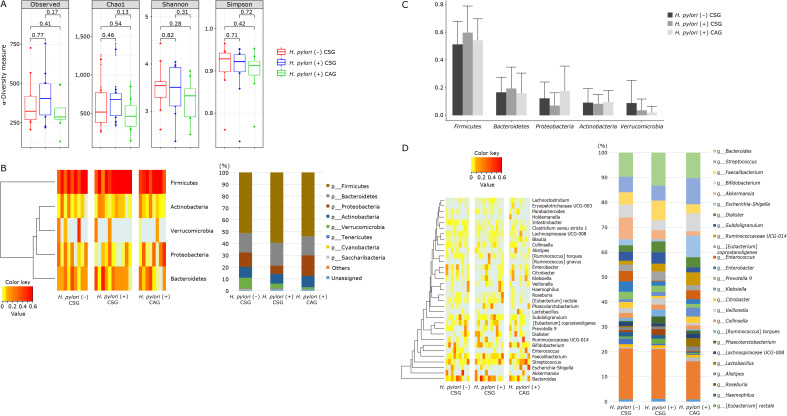
Fig. 2.
Relative abundance of the phylum level (% similarity) in collected feces samples by pyrosequencing. (A) α-Diversity in H. pylori (−) CSG, H. pylori (+) CSG, mild to moderate, and H. pylori (+) CAG, moderate to severe degree. (B) Microbiota at phylum levels, Heatmap and bar display. (C) Microbiota at phylum levels. (D) Relative abundance of the genus level (% similarity) in collected feces samples by pyrosequencing. Significant changes in microbiota among H. pylori (−) CSG, H. pylori (+) CSG, and H. pylori (+) CAG, all before kimchi intake.

