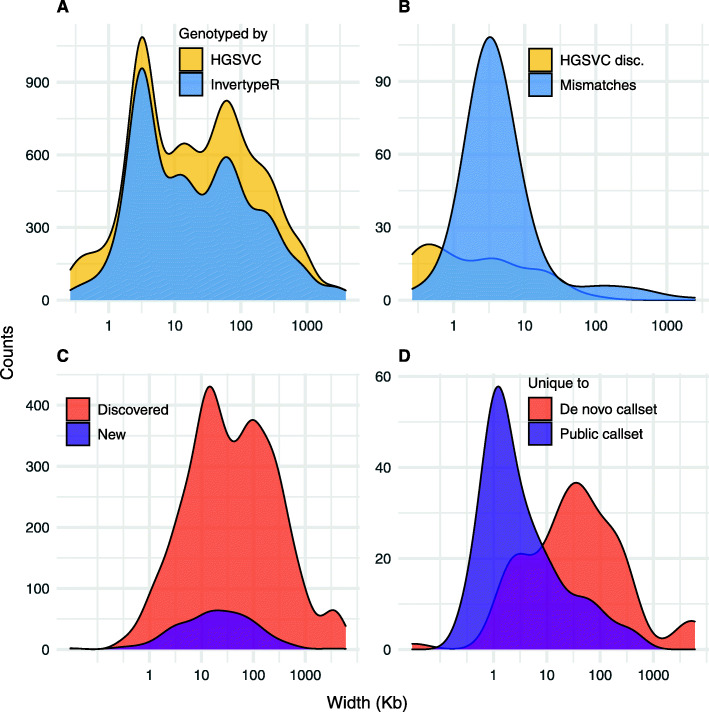
Fig. 3.
Size distributions of inversions for A all 2043 genotypes called by the HGSVC (yellow) and those which were re-genotyped in this study (light blue), B the HGSVC trio genotypes that show Mendelian discordance (yellow) and all trio genotypes with at least one mismatch between the InvertypeR and HGSVC genotypes (light blue), C all inversions discovered using the de novo callset or the public callset (red) and new inversions not reported by the HGSVC (purple), and D the inversions unique to the de novo callset (red) and those unique to the public callset (purple)

