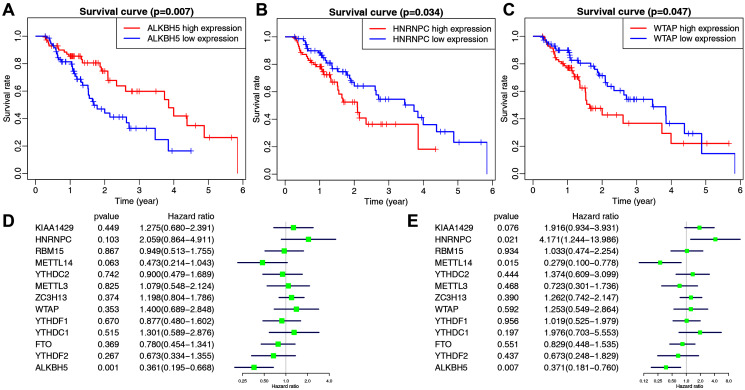
Figure 2. The correlation between the expression levels of m6A-related genes and overall survival (OS) rates in esophageal cancer patients (n = 162).
(A–C) Kaplan–Meier OS curve based on ALKBH5 expression (A), HNRNPC expression (B) and WTAP expression (C) in TCGA dataset. (D–E) Univariate (D) and multivariate (E) analyses of m6A-related genes associated with OS.

