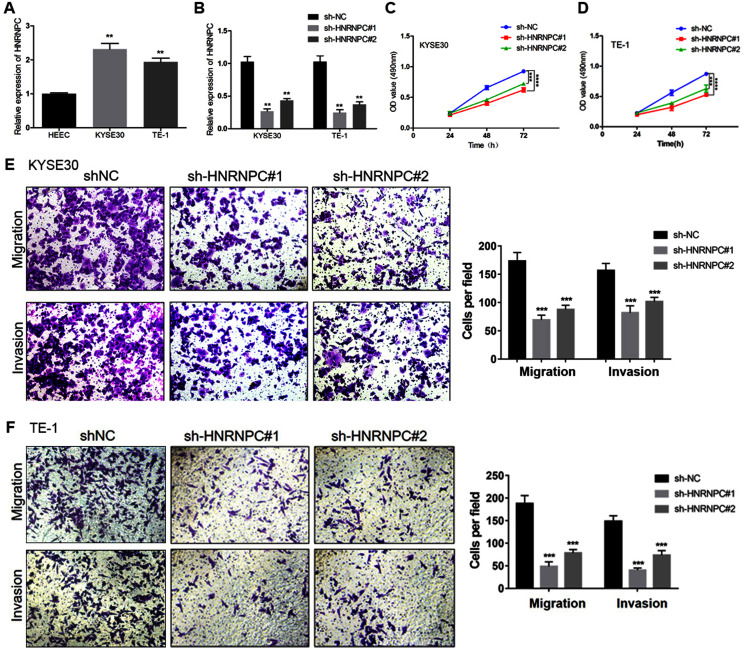
Figure 6. Silencing of HNRNPC suppressed proliferation, migration and invasion of KYSE30 and TE-1 Cells.
(A) The mRNA expression levels of HNRNPC in esophageal cancer cell lines (KYSE30 and TE-1) and normal esophageal epithelial cell line HEEC were determined by qRT-PCR. (B) The HNRNPC knockdown efficiency was confirmed at the mRNA levels in KYSE30 and TE-1 cells by qRT-PCR. (C–D) MTT assay was performed to determine the cell proliferation in KYSE30 (C) and TE-1 cells (D). (E–F) Transwell assay was performed to assess the cell migration and invasion capacity in KYSE30 (E) and TE-1 (F) cells. **P < 0.01; ***P < 0.001; ****P < 0.0001.

