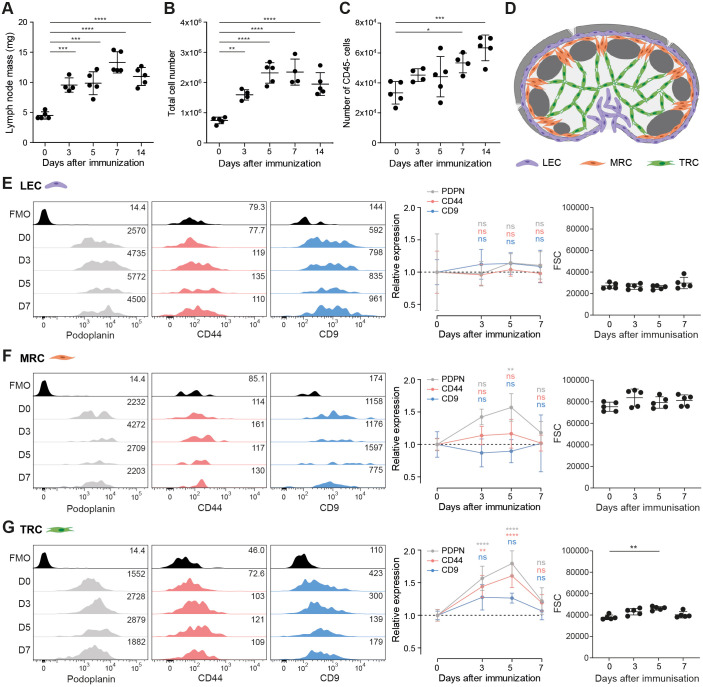
Fig. 1.
Increased expression of podoplanin and CD44 on TRCs upon in vivo immunization. (A) Mass (mg) of dissected inguinal lymph nodes. (B,C,E–G) Analysis by flow cytometry of cell suspensions of inguinal lymph nodes from C57BL/6 mice immunized with IFA/OVA for indicated time points. FRC population is based on total lymph node cell count×(percentage of live cells)×(percentage of CD45− cells). Gating strategy is included in Fig. S1A. (B) Total live-cell number based on the live-cell gate as measured by flow cytometry. (C) Number of CD45− cells. (D) Schematic representation of the location of different lymph node stromal cell subsets. Lymphatic endothelial cell (LEC; purple), marginal zone reticular cell (MRC; orange), and T-cell zone reticular cell (TRC; green). (E–G) Podoplanin (PDPN; grey), CD44 (pink) and CD9 (blue) surface expression on LECs (CD31+podoplanin+ MAdCAM-1−; E), MRCs (CD31−podoplanin+MAdCAM-1+; F) and TRCs (CD31−podoplanin+MAdCAM-1−; G) as measured by flow cytometry. Left panels show representative histograms of surface protein expression of podoplanin (grey), CD44 (pink) and CD9 (blue). FMO, fluorescence minus one. Numbers indicate geometric mean fluorescence intensity (gMFI). Middle panels show surface protein expression normalized to day 0 and relative gMFI expression for each marker per cell type is shown. Right panels show forward scatter (FSC) for each lymph node stromal cell subset. Error bars show s.d.; n=4–5 mice per time point. *P<0.05; **P<0.01; ***P<0.001; ****P<0.0001; ns, not significant [one-way (A–C) or two-way (E–G) ANOVA with Tukey's multiple comparisons; FSC data (G, right panel) was analysed using Kruskal–Wallis test with Dunn's multiple comparisons].

