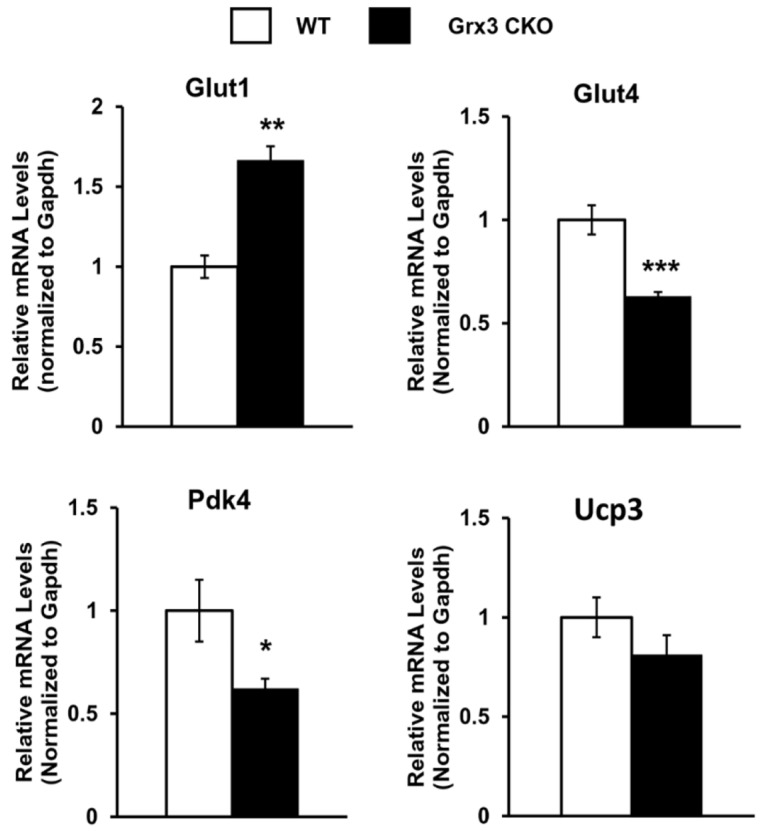
Figure 6.
Gene expression in the Grx3 CKO DIO heart. Q-PCR analysis indicates an increased Glut1, but reduced Glut4 and Pdk4 mRNA levels in the Grx3 CKO DIO heart, while Ucp3 expression was not altered. Gapdh was used as an internal control. Student t test, n=3, * p<0.05, ** p<0.01, and *** p<0.001 indicate the significance vs controls.

