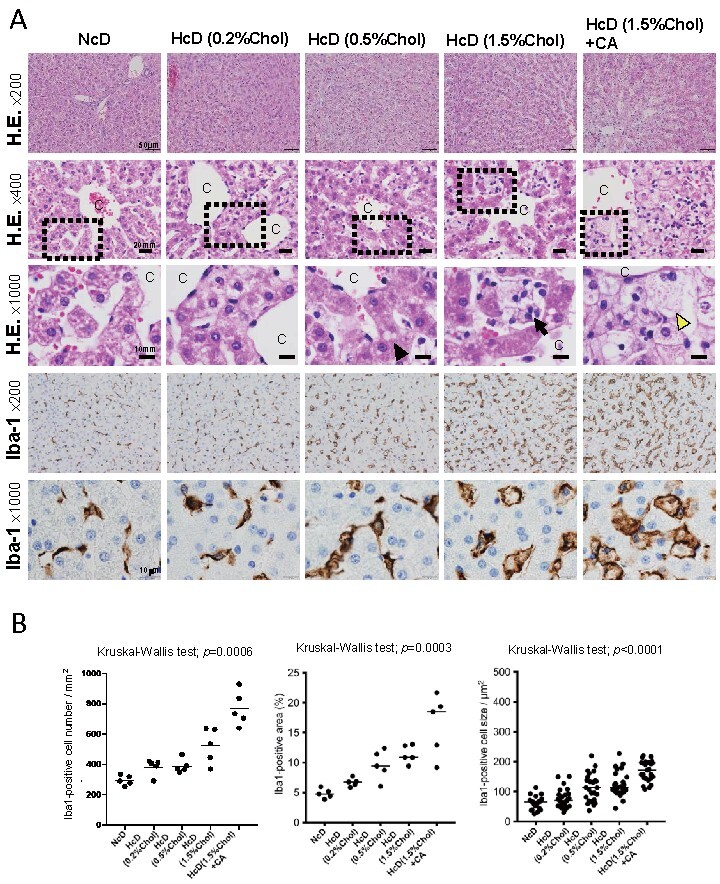
Fig.1. Changes in the pathological findings and the number of macrophages in the liver specimens of Microminipigs TM (µMPs) .

(A) Representative hematoxylin and eosin (H.E.) and immunohistochemistry (IHC) stainings of liver specimens in each group. The black arrowhead shows a lipid droplet, the black arrow shows a foamy macrophage, and the yellow arrowhead shows a ballooning hepatocyte. C, central vein. (B) Dot plots of the Iba-1-positive area, cell number, and cell size. All horizontal lines in the dot plots indicate median values. Chol, cholesterol; CA, cholic acid.
