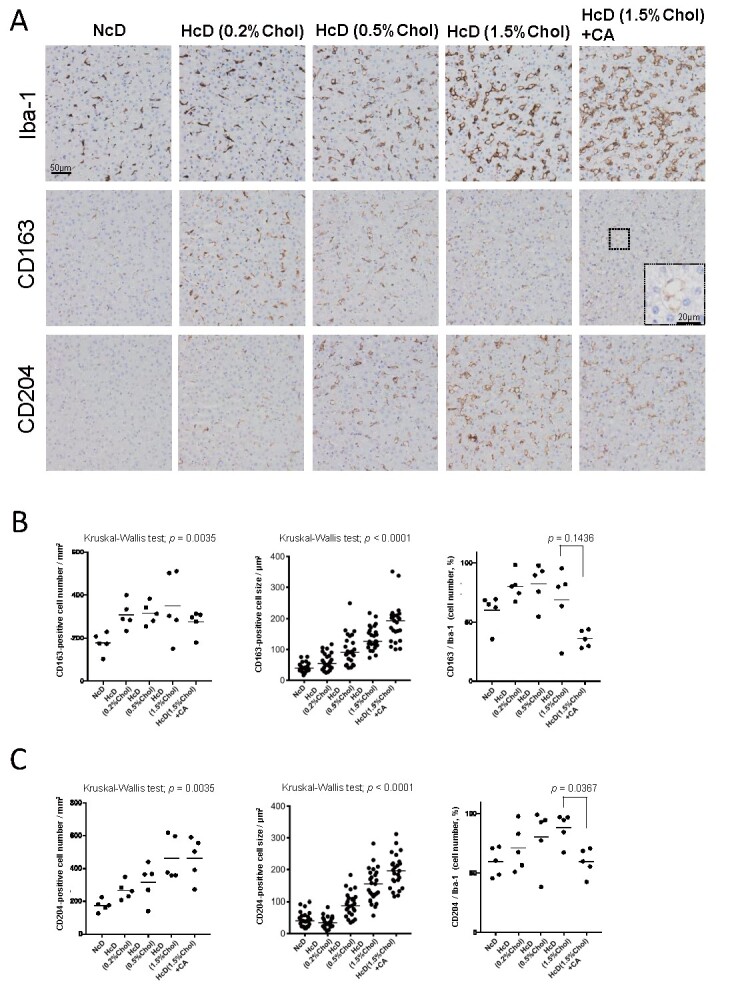
Fig.2. Changes in the density and morphology of CD163-positive macrophages and CD204-positive macrophages in the liver specimens of µMPs.

(A) Representative images of IHC staining of Iba-1-, CD163-, and CD204-positive macrophages in each group at the same site of serial sections. (B) Dot plots of the CD163-positive cell number, cell size, and the proportion of CD163/Iba-1 cell numbers. (C) Dot plots of the CD204-positive cell number, cell size, and the proportion of CD204/Iba-1 cell numbers. All horizontal lines in the dot plots indicate median values.
