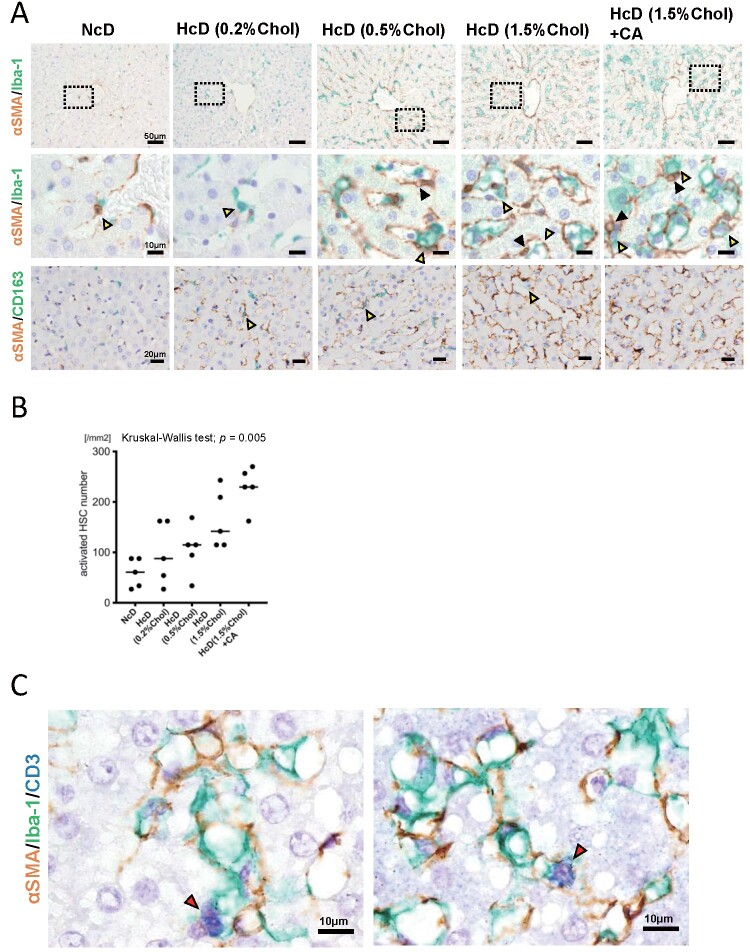
Fig.4. Changes in the density and morphology of macrophages and activated hepatic stellate cells (HSCs), and the microenvironment in NASH-like liver specimens of µMPs.
(A) Representative double-IHC staining of Iba-1 and αSMA-positive cells and CD163 and αSMA-positive cells in each group. The black arrowheads show lipid droplets in activated HSCs. The yellow arrowheads show Iba-1-positive macrophages attached to αSMA-positive activated HSCs, and CD163-positive macrophages attached to αSMA-positive activated HSCs. (B) Dot plots of the activated HSC number. Horizontal lines in the dot plots indicate median values. (C) Representative triple-IHC staining of Iba-1-, αSMA-, and CD3-positive cells in the group fed a high-fat/high-cholesterol diet with cholic acid. The red arrowheads show CD3-positive cells.

