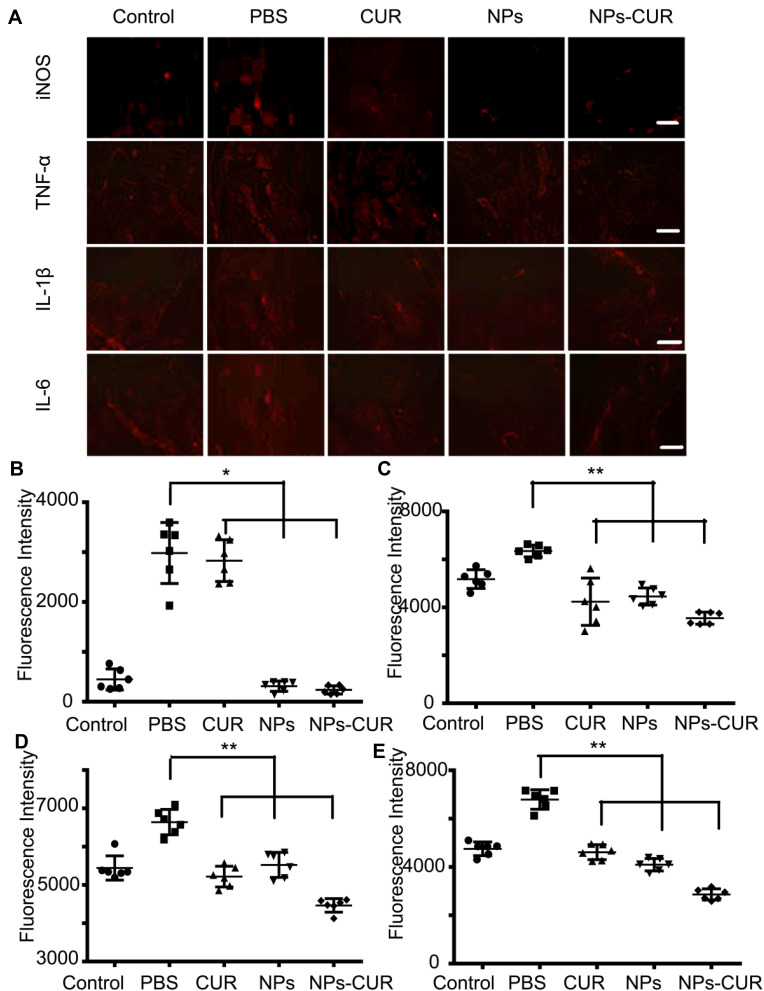
Figure 7.
Immunofluorescence analyses of a healthy ankle (Control group) or LPS-affected ankles after treatment with PBS, NPs, free CUR or NPs-CUR. (A) Images with scale bar of 100.0 mm. Statistical analysis by Image J for the fluorescence intensity of (B) iNOS, (C) TNF-α, (D) IL-1β, and (E) IL-6). *P < 0.05 and **P < 0.01 were considered statistically significant.

