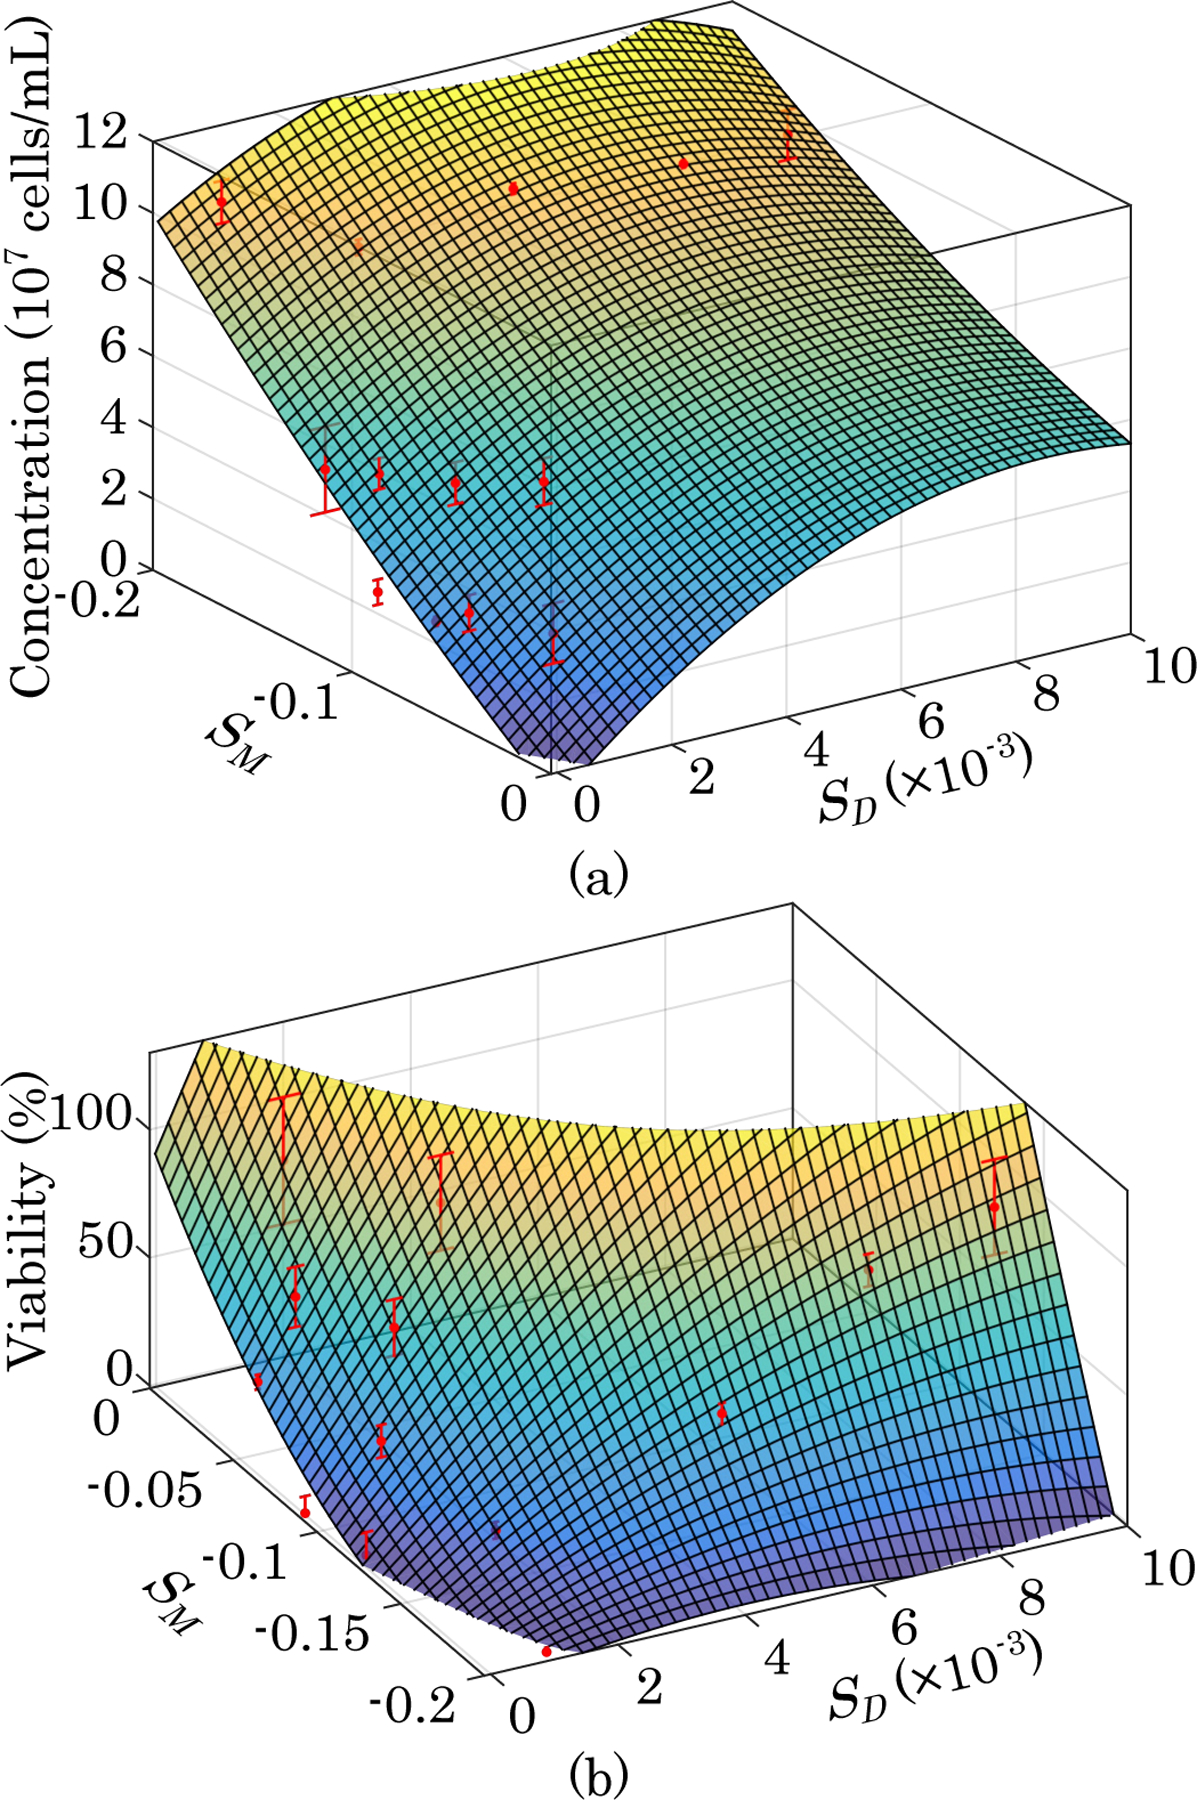
Fig. 2. 3D Viability and Density Calibrations.

(a) Plot of calibration surface overlaid on data showing cell concentration as a function of diffusion- and MT-weighted signals. (b) Plot of calibration surface overlaid on data showing cell viability as a function of diffusion- and MT-weighted signals (n=3).
