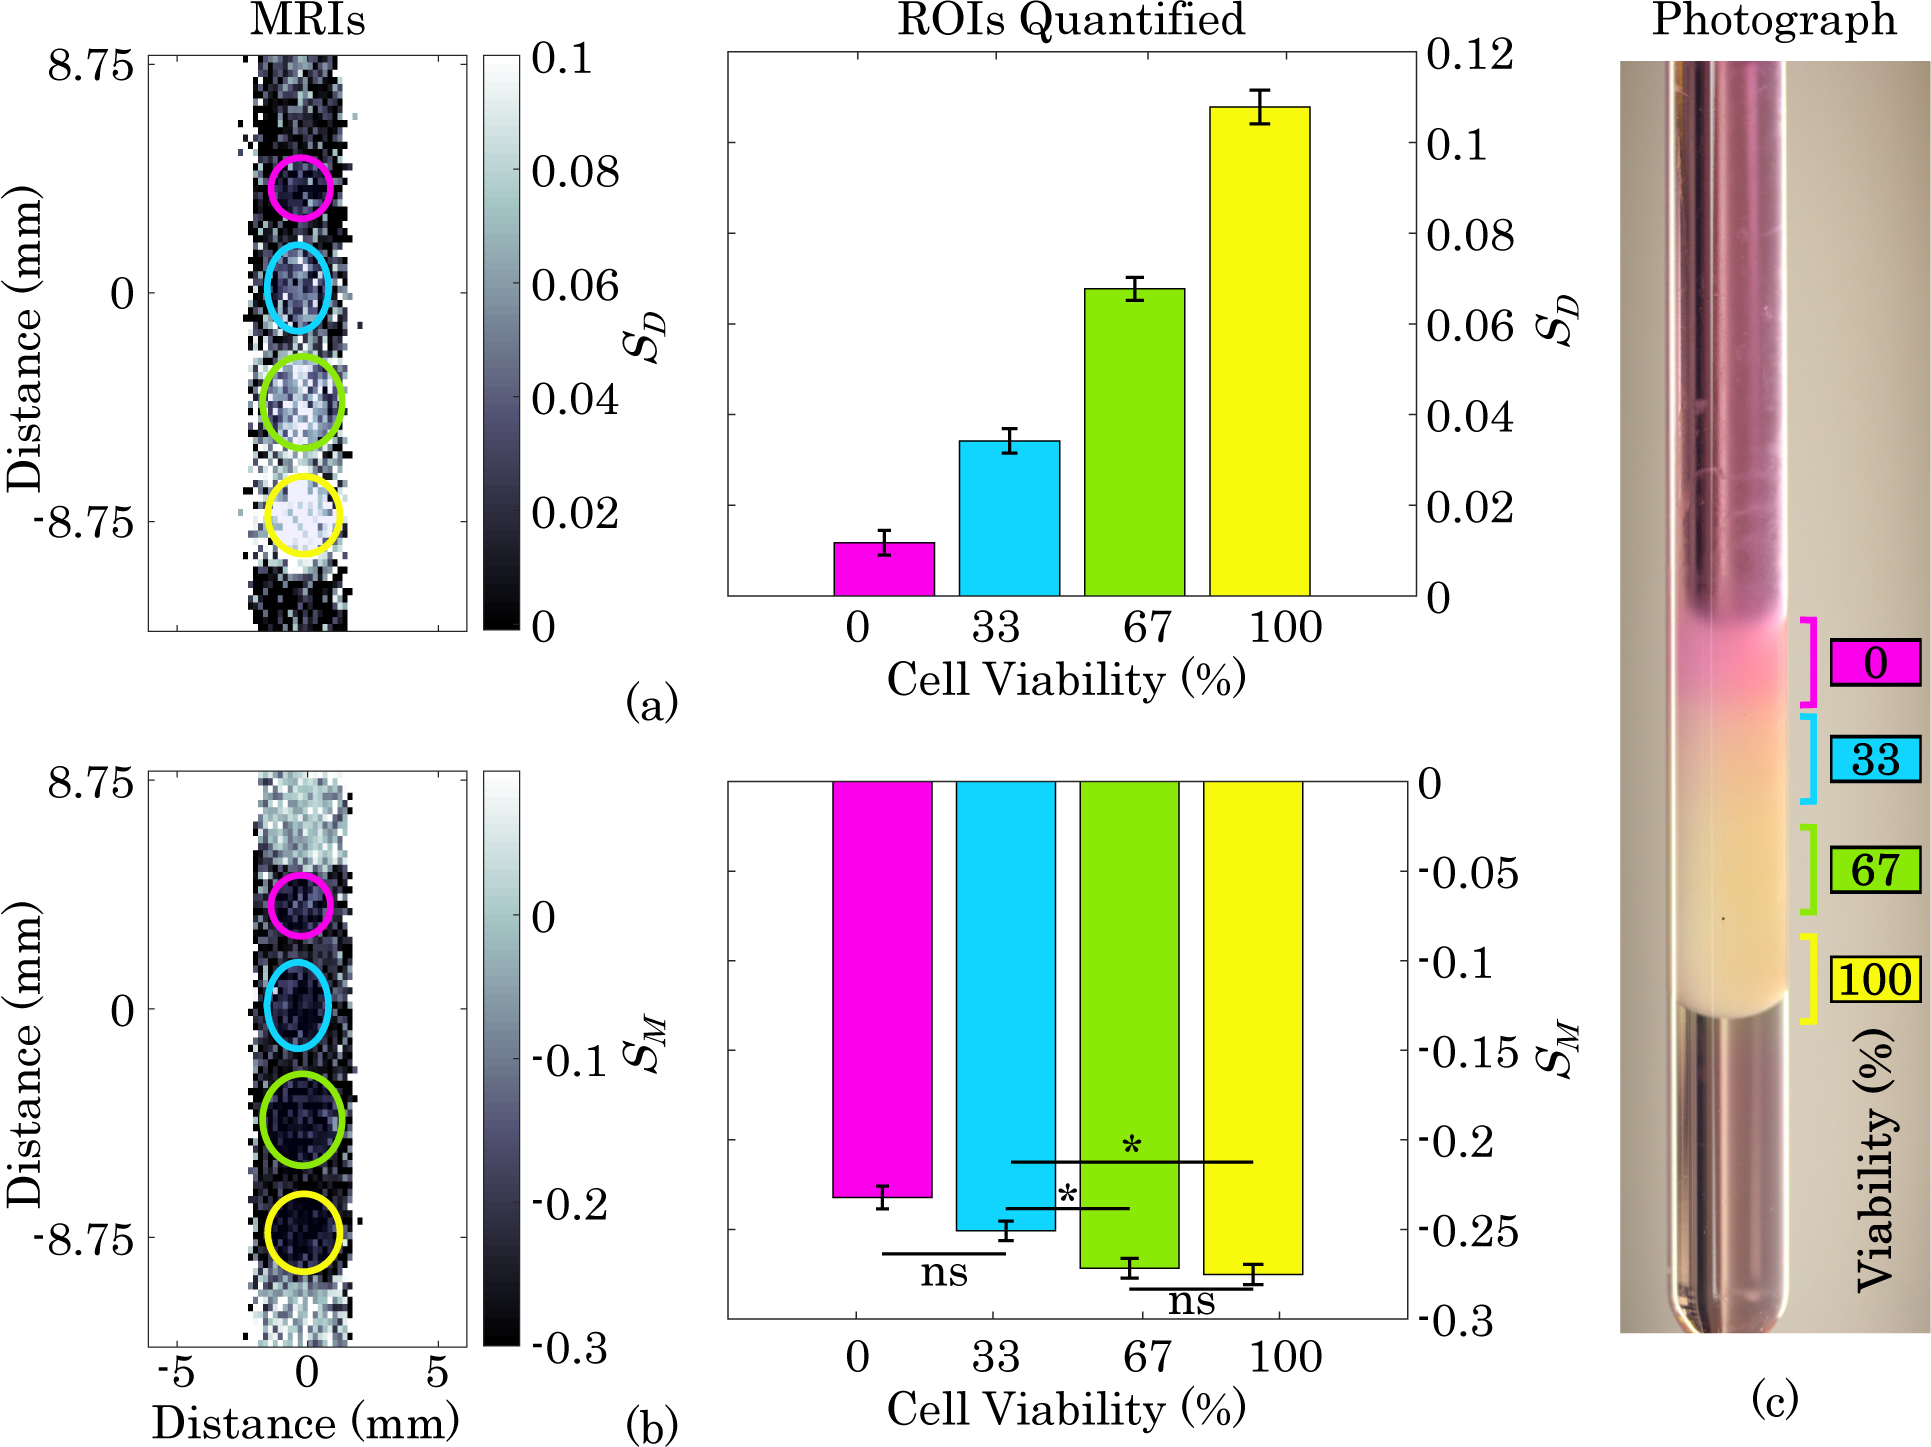
Fig. 3. Viability Gradient MRI.

(a) Diffusion-weighted MRI and quantification of layers of gel containing, from top to bottom, 0%, 33%, 66%, and 100% viable B16-F10 cells with a constant total cell density of 2×10⁸ cells·mL−1 Error bars represent one standard error. All groups have a statistically significant difference from each other (p<0.0001). (b) MT-weighted image and quantification of viability gradient sample. ns = not significant, * indicates significant difference (p <0.05), and all others are significantly different (p <0.0001). (c) Photograph of NMR tube containing viability gradient immediately after sample prep and prior to MRI acquisition.
