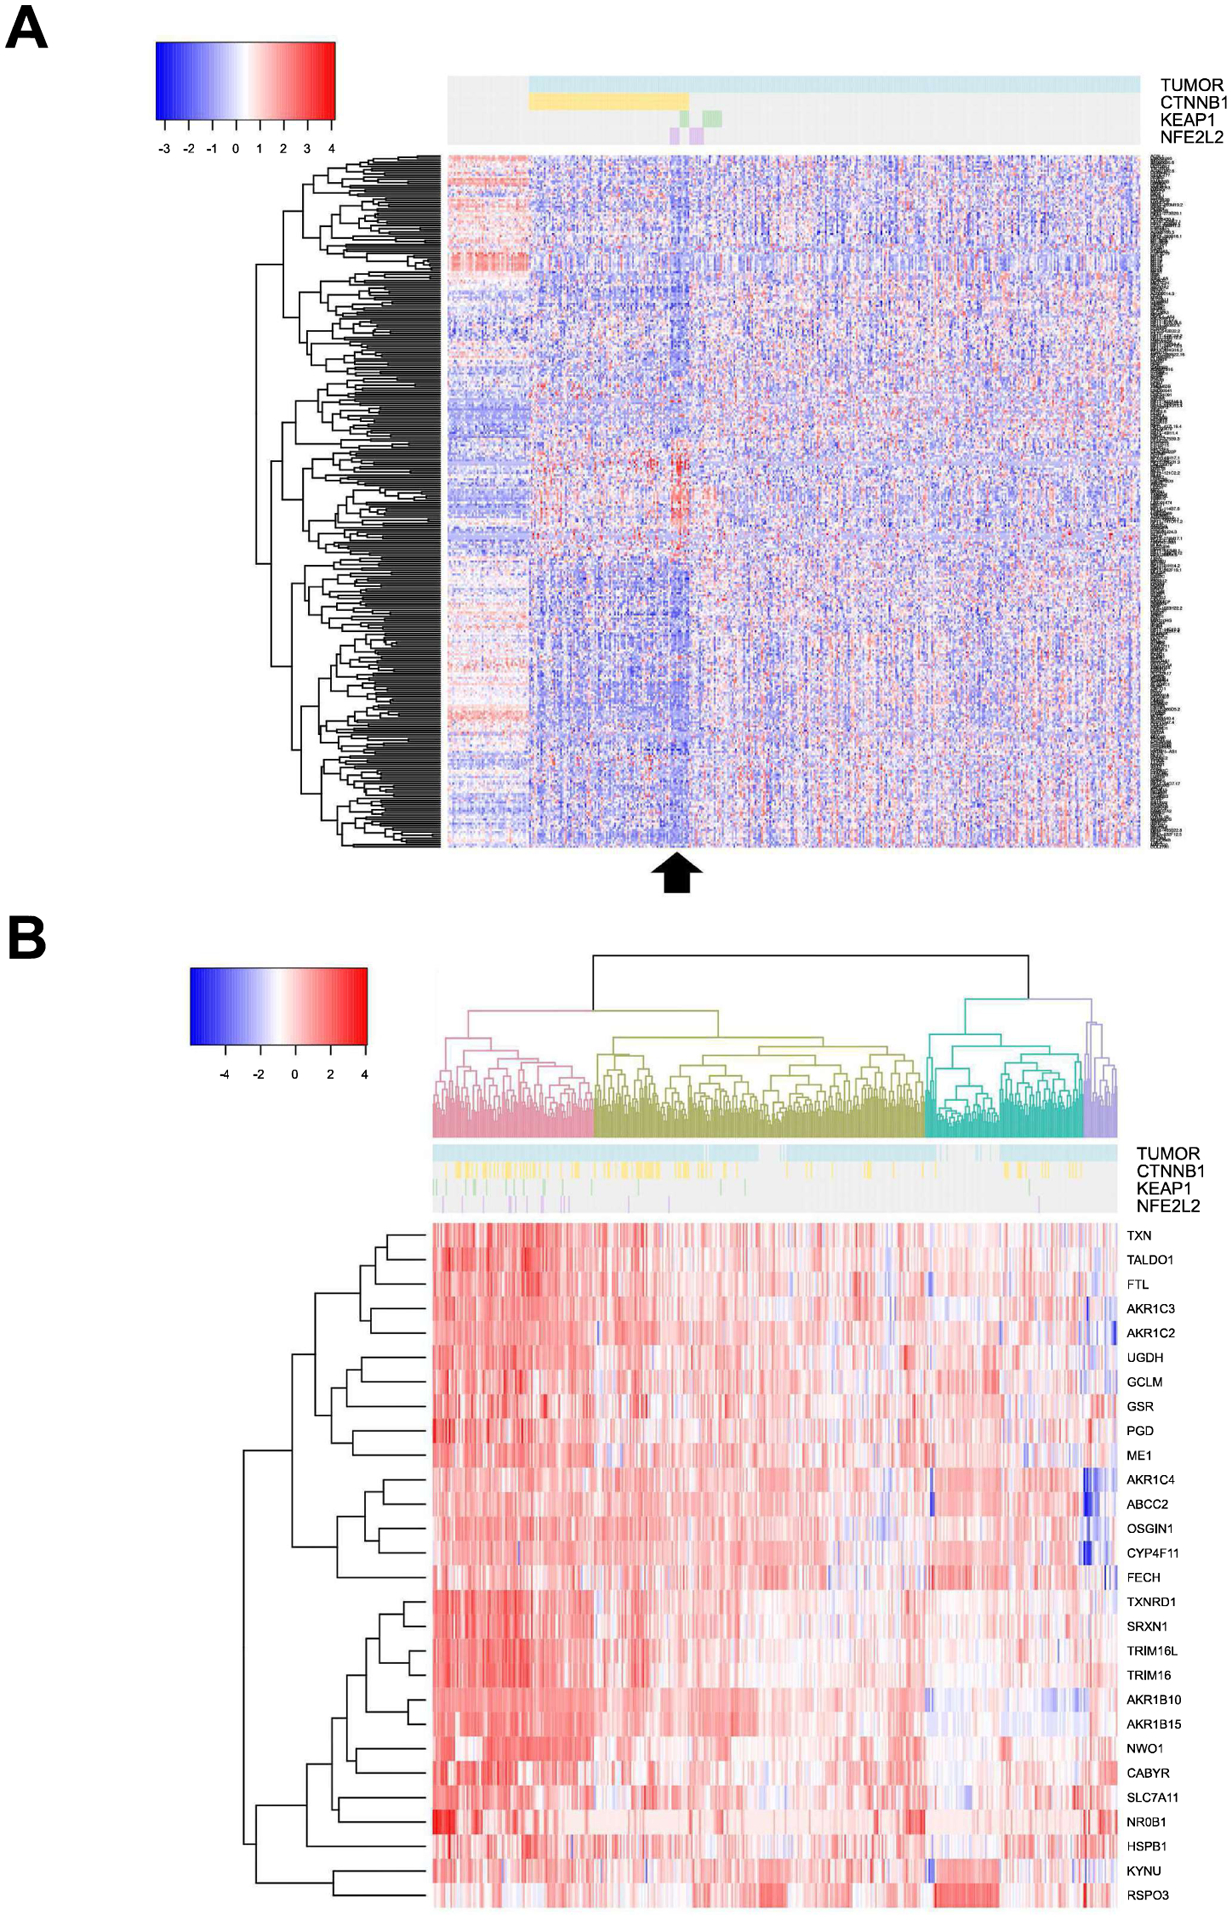
Figure 2: Effect of Nrf2 pathway mutations/activation on gene expression in HCC with and without CTNNB1-mutations.

(A). Heatmap of differentially expressed genes comparing 12 HCC cases with mutations in CTNNB1 and either KEAP1 (n=6) or NFE2L2 (n=6) versus 86 cases with CTNNB1 mutations without mutations in Nrf2 pathway components in the TCGA LIHC database. Arrow below identifies these 12 HCC cases. (B) Hierarchical cluster analysis based on 28-gene signature previously identified as a biomarker of Nrf2 pathway activation identifies four clusters identified in different colors with Nrf2-active tumors identified in pink. Of the CTNNB1-mutated cases, 35 were Nrf2-active. For both (A) and (B), each row represents a DEG and each column represents a case. Tumors are identified in blue, CTNNB1-mutated cases in yellow, KEAP1-mutated cases in green and NFE2L2-mutated cases in purple.
