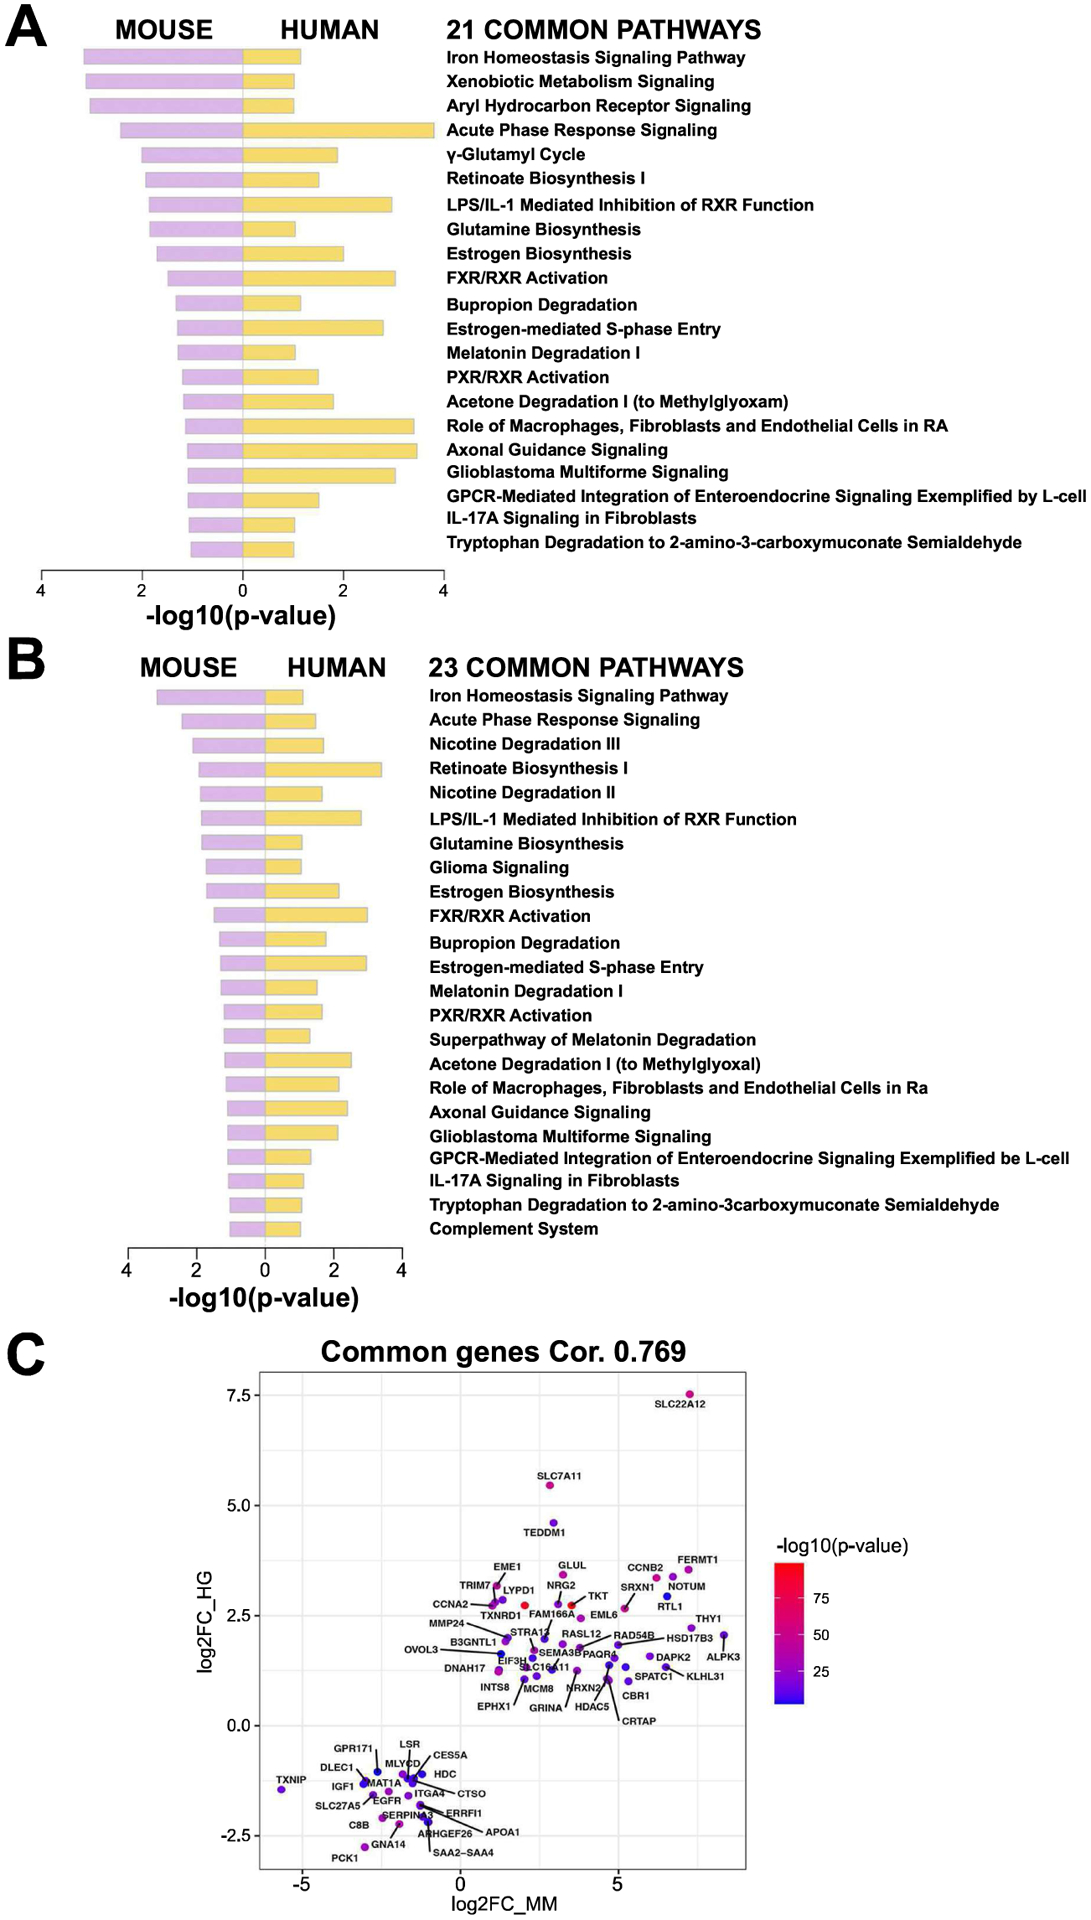
Figure 7: Ingenuity pathway analysis (IPA) comparing preclinical HCC to clinical HCC with either combined CTNNB1 mutations and NFE2L2/KEAP1 mutations, or CTNNB1 mutations and Nrf2 activation.

(A) 21 common pathways detected when comparing IPA using DEGs identified in HCCs in combined T41A-CTNNB1-G31A-NFE2L2 and T41A-CTNNB1-T80K-NFE2L2 NFE2L2-models (versus normal control livers) to human HCC subset with both CTNNB1 and NFE2L2/KEAP1 mutations (versus normal or adjacent normal livers). (B) 23 common pathways detected when comparing IPA using DEGs identified in HCCs in combined T41A-CTNNB1-G31A-NFE2L2 and T41A-CTNNB1-T80K-NFE2L2 NFE2L2-models (versus normal control livers) to human HCC subset with both CTNNB1 mutations and Nrf2 activation using published signature (versus normal or adjacent normal livers). (C) 64 key genes showed an overlap between preclinical HCC model (combined) and HCC subset with CTNNB1 and NFE2L2/KEAP1 mutations, with high correlation (0.769 by Pearson correlation). Mouse gene expression is plotted on x-axis (MM) and human on y-axis (HG).
