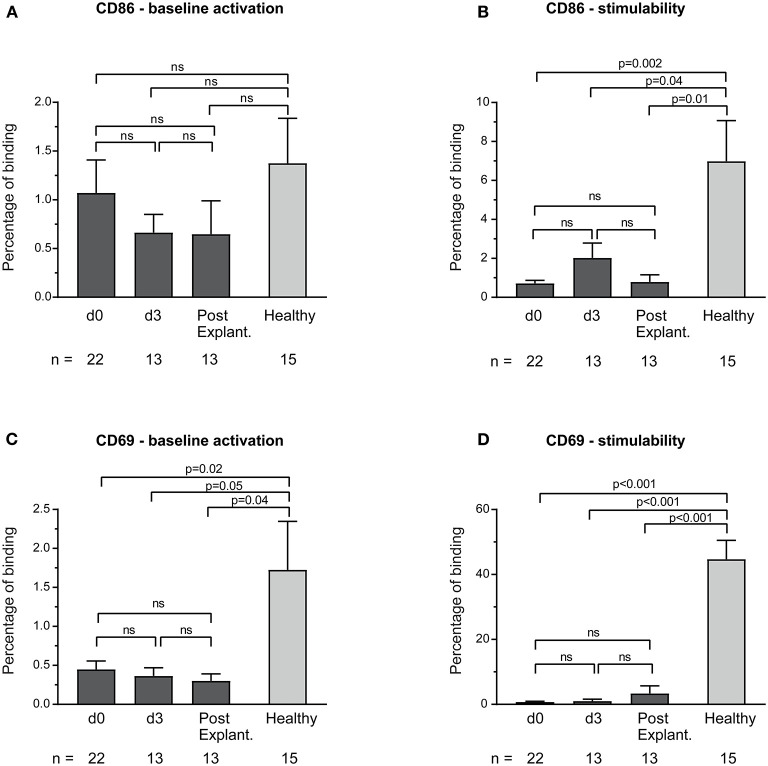
Figure 3.
Baseline monocyte activation and stimulability as determined by CD86 (A,B) and CD69 (C,D) surface expression. The number of remaining patients analyzed at each time point during VA-ECMO therapy (d0, d3) and after explantation (post explant.) is presented below the individual bars. Baseline monocyte activation was measured in phosphate buffered saline treated samples. Stimulability was assessed in samples treated with phorbol 12-myristate 13-acetate to induce maximum monocyte activation. CD14+ monocyte CD69 and CD86 surface expression is presented in percentage and was quantified as described in the Materials and Methods section. ns, not significant. Baseline expression levels of CD86 and CD69 were low in healthy controls and patients. Mixed effects models were used to analyze differences between means across different time points (d0, d3, and post explantation vs. each other). Unpaired t-tests were used to analyze differences of means at single time points. Data are presented as mean ± SEM.

