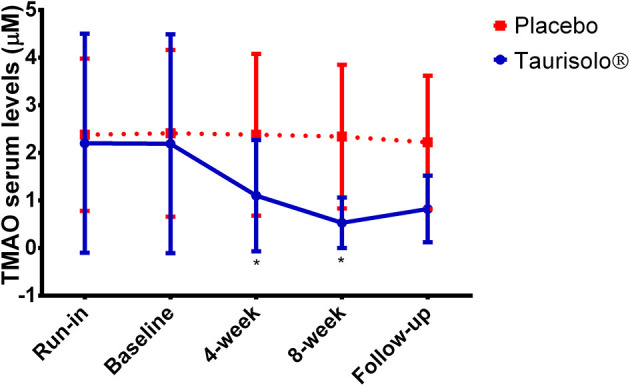
Figure 2.

Graphical representation of the TMAO serum levels at the different time points. Values are expressed as mean ± standard deviation. Statistical significance was calculated with Student's t-test; p < 0.05 was considered as significant. *P < 0.0001, Taurisolo® group, compared to baseline.
