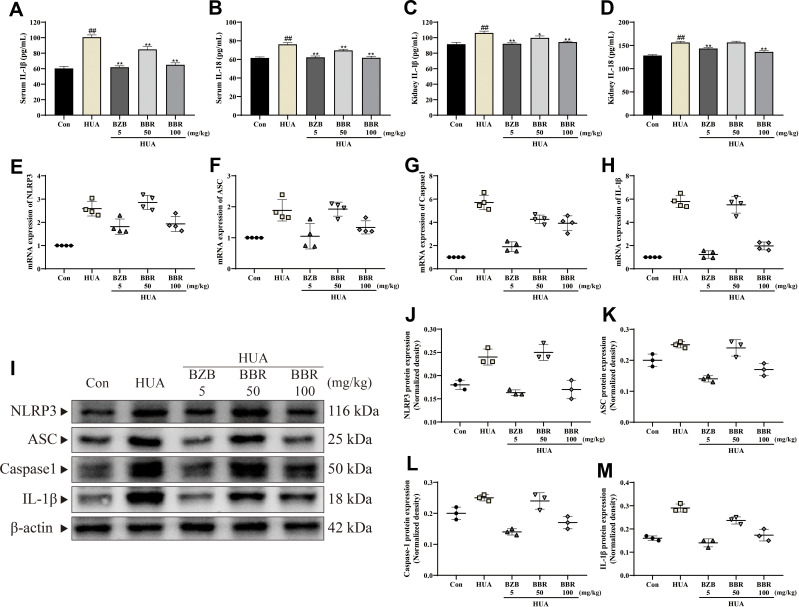
Figure 6.
BBR suppressed NLRP3 inflammasome activation. Levels of (A) IL-1β and (B) IL-18 in serum. Levels of (C) IL-1β and (D) IL-18 in kidneys (n=10). mRNA expression levels of (E) NLRP3, (F) ASC, (G) caspase1, and (H) IL-1β (n=4). (I) Representative Western blots of NLRP3, ASC, caspase1, and IL-1β protein expression. Quantitative analysis of (J) NLRP3, (K) ASC, (L) caspase1, and (M) IL-1β protein expression (n=3). All the results are shown as mean ± SEM. ##p<0.01 vs Con group. *p<0.05 and **p<0.01 vs HUA group.

