
Figure 3.
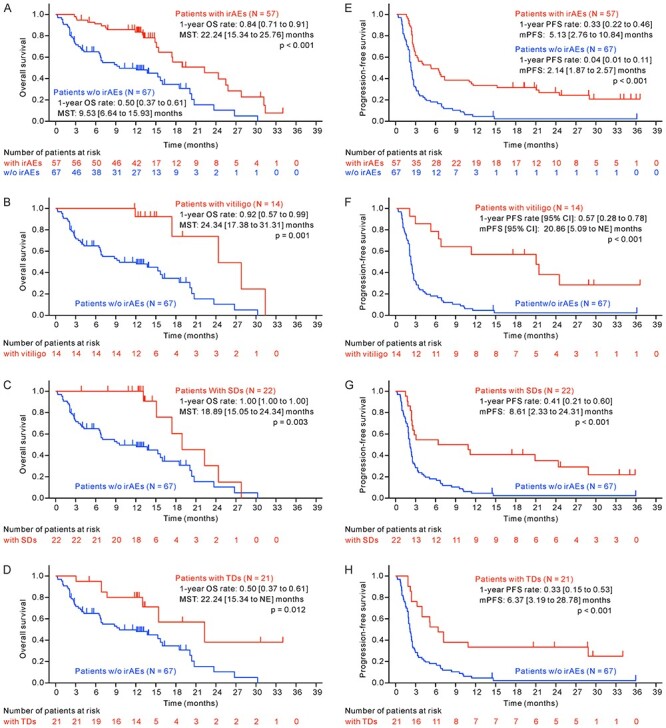
Survival analysis comparing subgroups with and without irAEs. OS and PFS were compared between patient subgroups without and with any irAEs (A and E), without and with vitiligo (B and F), without and with SDs (C and G), and without and with TD (D and H). The 1-year OS rate, MST, 1-year PFS, mPFS, and their 95% CIs [lower to upper bound] were estimated by Kaplan–Meier analysis. All P values were computed by a two-sided log-rank test. irAEs, immune-related adverse events; SDs, skin disorders; TD, thyroid dysfunctions; NE, not estimable.