
Figure 4.
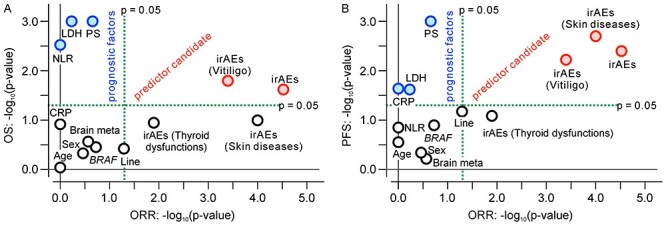
Summary of subgroup analyses to assess prognostic or predictive values for nivolumab in patients with malignant melanoma. The −log10 (P value) of the survival difference was plotted against the −log10 (P value) of the response rate difference between subgroups with and without a factor of interest in each subgroup analysis. (A) OS against ORR. (B) PFS against ORR. Notably, the P values in the 3-month landmark survival analysis for irAEs might have been underestimated because the sample size was smaller than in the other analyses. ORR, objective response rate; age, ≥65 versus <65 years; brain meta, brain metastasis (absent vs. present); BRAF, wild type versus mutation; irAEs, immune-related adverse events (patients with vs. without irAEs, OS and PFS by 3-month landmark analysis); irAEs (vitiligo, skin disorders or thyroid dysfunctions), patients with specified irAEs versus 67 patients without any irAEs, OS and PFS by 3-month landmark analysis; CRP, C-reactive protein (≥1.0 vs. <1.0 mg/dl); LDH, lactate dehydrogenase (≥400 vs. <400 IU/L); Line, treatment line (first vs. second line); NLR, neutrophil-to-lymphocyte ratio (median or greater vs. less than median); PS, performance status (0 vs. ≥1); sex, male vs. female.