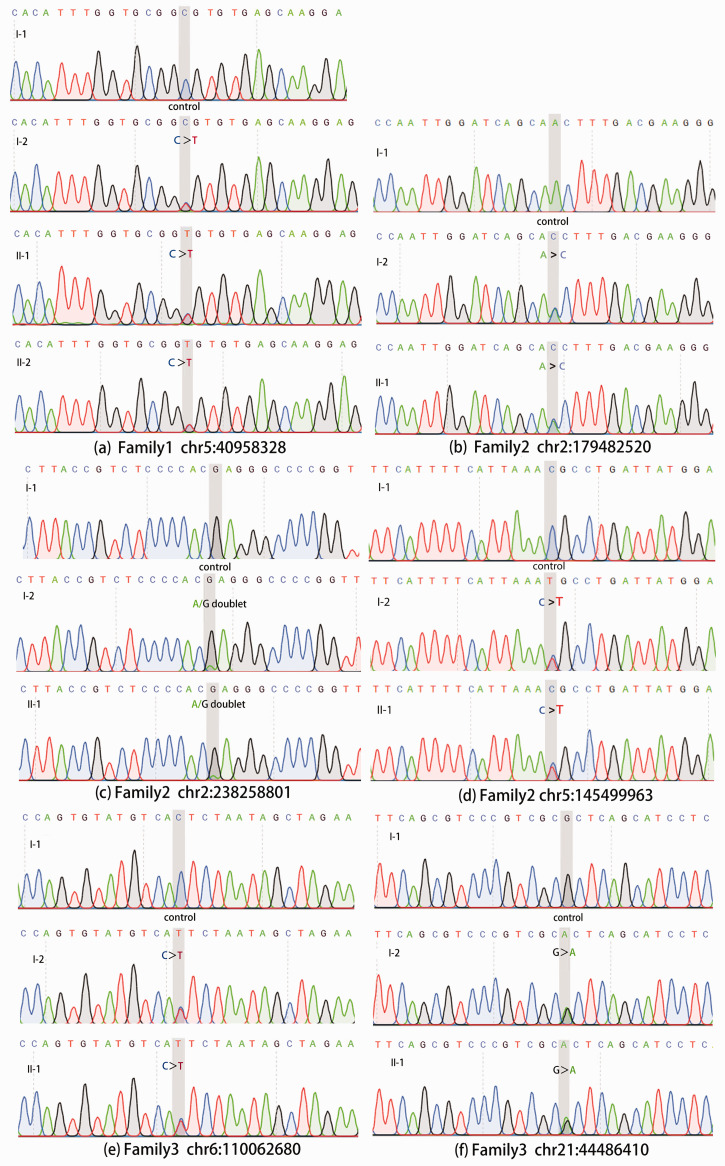
Figure 2.
Sanger sequencing results of highlighted variants. The chromatograms show the sanger sequencing results of some of the mutations that this study focused on. The coordinates of the mutation (GRCh37) are marked below the graph group, and the gray vertical shading in the chromatogram indicates its location. The subject number corresponding to each chromatogram is marked on the upper left. The color of each base peak corresponds to the color of the base letter above. The height of the peak represents the relative signal strength of this base.

