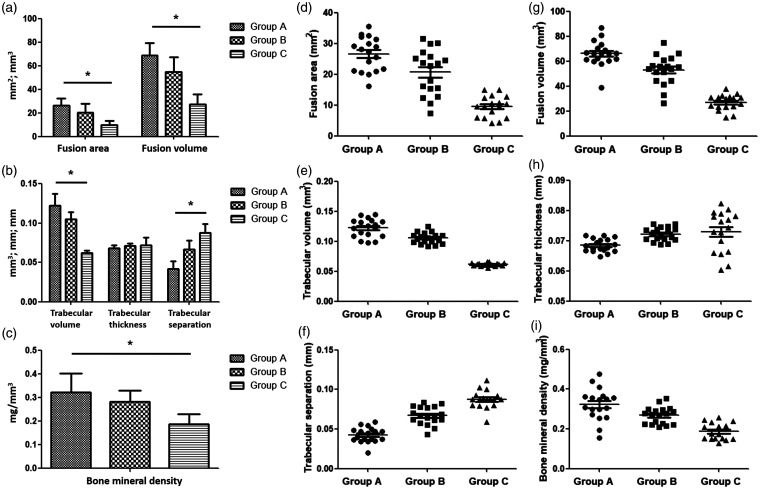
Figure 5.
Assessment of the new bone formation by μCT. (a) Mean fusion area (FA) in cross-section view and total fusion volume (FV) in 3D reconstruction of new bone formation were greater in Group A including 18 survived rats than Group B including 18 rats and Group C with 17 rats. (b) Compared with Groups B and C, Group A had the larger trabecular volume (TV) and smaller trabecular separation (TS). Trabecular thickness (TT) was similar among the three groups. (c) Bone mineral density was larger in Group A than the other two groups. Statistical significance was *P < 0.05. (d-i) The data were presented as dot plots.

