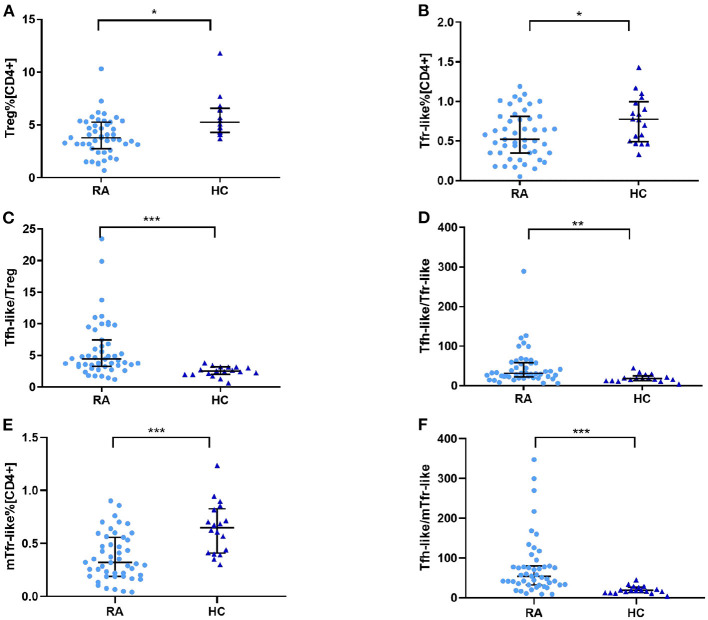
Figure 3.
(A) Treg cell percentage [CD4+], (B) Tfr-like cell percentage [CD4+], (E) mTfr-like cell percentage [CD4+], and (C) Tfh-like/Treg, (D) Tfh-like/Tfr-like, and (F) Tfh-like/mTfr-like cell ratios in the peripheral blood of RA patients and healthy controls. Data are shown as the median and interquartile range. The Mann–Whitney U test was used to compare the median values. *p < 0.05, **p < 0.01, ***p < 0.001. Tfr-like, T follicular regulatory-like; mTfr-like, memory T follicular regulatory-like; Tfh-like, T follicular helper-like; Treg, T regulatory.

