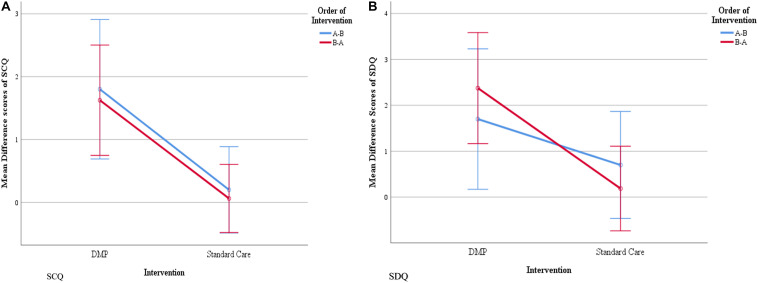
FIGURE 3.
Mean difference in pre- and post- intervention scores for SCQ (A) and SDQ (B), separated by the order of interventions received. The blue line represents the order of interventions (A) (DMP intervention) then (B) (standard care) and the red line represents the order of intervention (B) then (A). Blue and red vertical lines, parallel to Y axis represent error bars with 95% confidence intervals.

