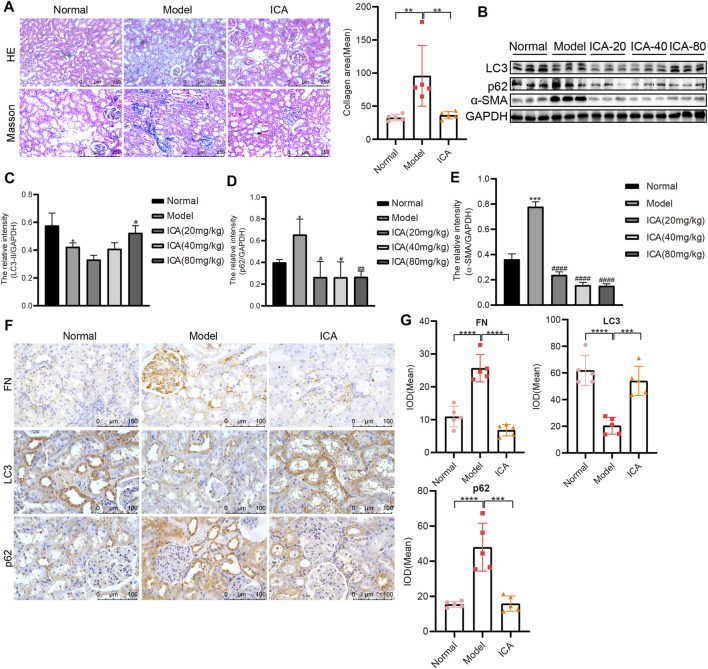
FIGURE 2.
ICA promotes autophagy and alleviates renal fibrosis in T2DN rats (A) Representative image of HE and Masson staining in Normal, Model and ICA + Model group (Scale bar: 250 μm; original magnification: ×200). ICA was administered at 80 mg/kg. Error bars represent SD; n = 5; **p < 0.01 (B) Results of LC3, p62, and α-SMA, as determined by Western blot (C–E) Representative Western blot analysis of LC3, p62, and α-SMA expression in rat renal tissues. Error bars represent SD; n = 3; *p < 0.05, ***p < 0.001, vs Normal; # p < 0.05, ## p < 0.01, #### p < 0.0001 vs Model (F) Immunohistochemical staining of FN, LC3, and p62 in rat renal tissues (Scale bar: 100 μm; original magnification: ×400) (G) The mean IOD of LC3, p62, and FN expression was analyzed by IPP software. Error bars represent SD; n = 5; ***p < 0.001, ****p < 0.0001.

