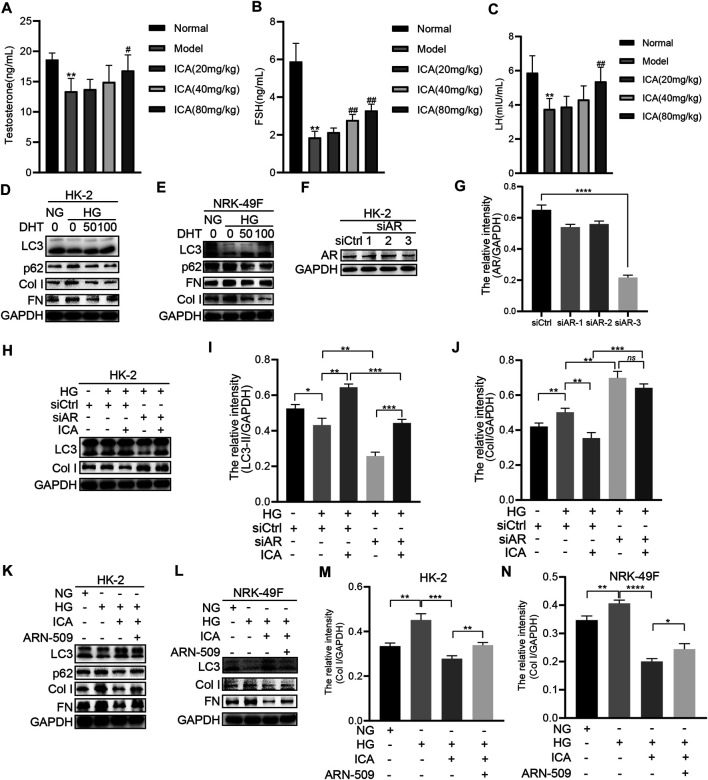
FIGURE 4.
ICA induces autophagy and reduces fibrosis by regulating AR (A–C) The serum testosterone, FSH, and LH concentrations were detected by ELISA. Data are expressed as mean ± SD (n = 8). **p < 0.01, vs the Normal group; # p < 0.05, ## p < 0.01, vs the Model group (D–E) HK-2 and NRK-49F cells were treated with HG and DHT for 48 h, then the expression of LC3, p62, Col I, and FN was detected by Western blot (F–J) HK-2 cells were transfected with siAR or NC, then treated with or without ICA (50 μM), the expression of AR, LC3, and Col I was evaluated by Western blot and analyzed by the ChemiScope analysis software (*p < 0.05, **p < 0.01, ***p < 0.001, ****p < 0.0001) (K–N) HK-2 and NRK-49F cells were treated with HG, ICA (50 μM) or ARN-509 (80 nM), and the expression of LC3, p62, Col I, and FN was detected by Western blot and the relative intensity of Col I was analyzed by the ChemiScope analysis software (*p < 0.05, **p < 0.01, ***p < 0.001, ****p < 0.0001).

