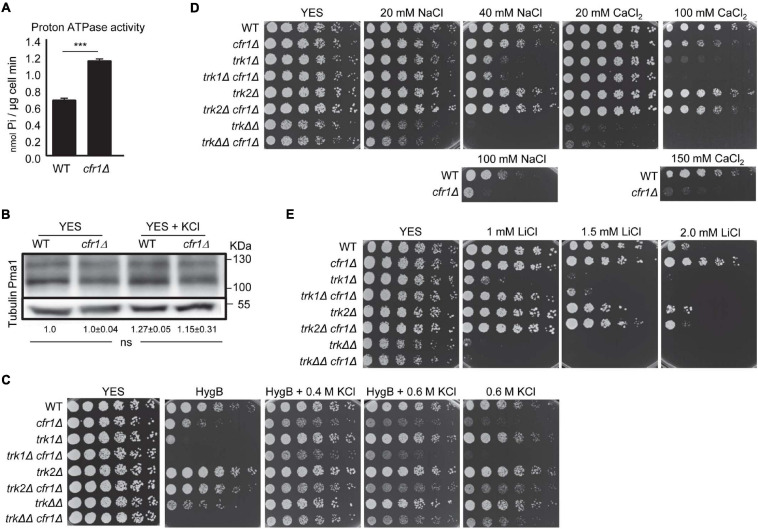
FIGURE 3.
Analysis of membrane polarization in exomer mutants. (A) Measurement of ATPase activity (nmol Pi/μg cell minute) in the wild-type (WT) and cfr1Δ extracts. For each value, the mean of three independent experiments, standard deviation, and statistical significance of the difference, determined using the t-test are shown (***p < 0.001). (B) Cell extracts from the WT and cfr1Δ strains, incubated in YES and YES with 0.6 M KCl, were subjected to SDS-PAGE and immunoblotted with polyclonal anti-S. cerevisiae Pma1 (upper panel) and anti-tubulin (lower panel; loading control) antibodies. The relative position of molecular weight markers is indicated on the right (KDa). The intensity of each Pma1 band was relativized to the value for the corresponding tubulin band, and all the values were relativized to the value for the WT grown in YES. For each value, the mean of three independent experiments, standard deviation, and statistical significance of the difference, determined using the Tukey’s multiple comparisons test are shown (ns, non-significant). (C) Cells from the indicated strains were spotted on YES (rich medium) and YES supplemented with 2 μg/ml hygromycin B (HygB), 2 μg/ml hygromycin B with KCl, and KCl without hygromycin B. WT, wild-type; trkΔΔ, trk1Δ trk2Δ. (D) The same experimental details as in (C), but the cells were spotted on YES plates supplemented with different amounts of NaCl and CaCl2. The lowest panels show the growth of the WT and cfr1Δ on plates supplemented with high concentrations of the same compounds. (E) The same experimental details as in (C), but the cells were spotted on YES plates supplemented with different amounts of LiCl.

