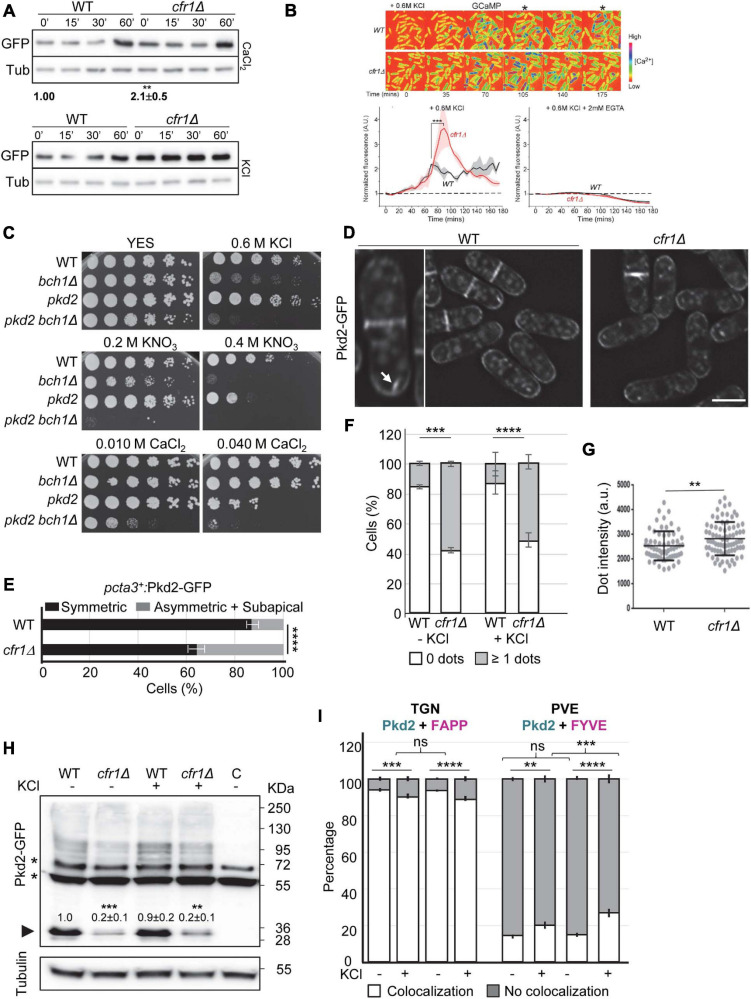
FIGURE 5.
Relationship between exomer and calcium homeostasis. (A) Upper panel, cell extracts from the wild-type (WT) and cfr1Δ cells containing pCDRE-GFP and treated with 0.15 M CaCl2 for the indicated times (minutes). The numbers below the blot indicate the relative intensity of GFP/tubulin at 0′. Three independent experiments were performed; in all cases, the values for the mutant were relativized to the values for the WT, which were considered 1.00. The media, standard deviation and significance of the statistical differences for cfr1Δ are indicated. Lower panel, the same experimental details as in (A), but the cells were treated with 0.6 M KCl for the indicated times. (B) Upper panel, time-lapse micrographs of wild-type (WT) and cfr1Δ cells after the addition of YES plus 0.6 M KCl. Numbers represent time points (minutes). The cells express the fluorescent GCaMP6s calcium indicator, and the colored spectrum shown on the right indicates the fluorescence level ([Ca2+]). The asterisks denote time-points when the calcium level in cfr1Δ was apparently different from that in the WT. Lower left panel, average time courses of the normalized GCaMP6s fluorescence intensity after the addition of the salt. Cloud represents the standard deviations. Data represent the average from two biological repeats. Lower right panel, the same experimental procedure, but the experiment was performed in the presence of KCl and EGTA. (C) Cells from the indicated strains were spotted on YES (rich medium) and YES supplemented with the indicated compounds. WT, wild-type; pkd2, pkd2-81KD mutant. (D) Micrographs of WT and cfr1Δ cells bearing Pkd2-GFP and incubated in YES. The panel on the left is an enlargement of a WT cell. The arrow denotes an intracellular Pkd2-GFP dot. Scale bar, 10 μm. (E) Quantitative analysis of the patterns of distribution of Pkd2-GFP in WT and cfr1Δ cells where pkd2+ was under the control of the cta3+ promoter. Cells were incubated in 0.6 M KCl for 1 h. (F) Percentage of WT and cfr1Δ cells, incubated in YES and YES with 0.6 M KCl for 1 h, that exhibited no fluorescent intracellular Pkd2-GFP dots, or at least one dot. (G) Dot-plot representation of the fluorescence intensity of intracellular Pkd2-GFP dots in WT and cfr1Δ cells incubated in 0.6 M KCl for 1 h. (H) Cell extracts from the indicated strains containing Pkd2-GFP incubated in YES with and without 0.6 M KCl. The lane on the right (C) corresponds to extracts from a strain without GFP, used to determine the unspecific bands, which are denoted by asterisks. The arrowhead denotes clipped GFP. Tubulin was used as a loading control. The intensity of each GFP band was relativized to the value for the corresponding tubulin band, and all the values were relativized to the value for the WT grown in YES. (I) Quantification of the colocalization of Pkd2-GFP and the TGN marker mCherry-FAPP (left panel) or the PVE marker mCherry-FYVE (right panel) in the WT and cfr1Δ strains incubated in 0.6M KCl for 1 h. In (A,H), equal amounts of protein in the cell extracts were subjected to SDS-PAGE, and were immunoblotted with anti-GFP (upper panel) and anti-tubulin (lower panel; Tub, loading control) antibodies. In (F–I), the cells were incubated in YES (KCl–) and in YES with 0.6M KCl (KCl+) for 1 h. For each value, the mean of three independent experiments, standard deviation, and statistical significance of the difference are shown. The statistical differences were determined using the t-test (A,B,G), Sidak’s multiple comparisons test (E,F) and Tukey’s multiple comparisons test (H,I). ns, non-significant; **p < 0.01; ***p < 0.001; ****p < 0.0001.

