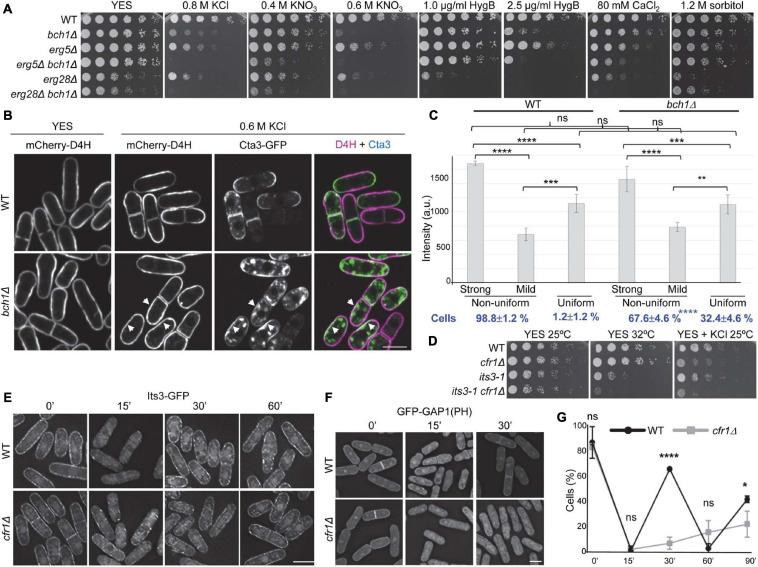
FIGURE 7.
Relationship between exomer and plasma membrane lipids. (A) Cells from the indicated strains were spotted on YES (rich medium) and YES supplemented with the indicated compounds. (B) Wild-type (WT) and bch1Δ cells bearing the sterol-binding probe mCherry-D4H and Cta3-GFP incubated in YES and YES with 0.6 M KCl for 1 h were photographed under a confocal DragonFly microscope. Single-channel and merged images are SUM projections. Arrowheads denote membrane regions with strong GFP and mCherry signals. (C) Intensity of mCherry-D4H fluorescence (a.u., arbitrary units) in WT and bch1Δ cell regions with a uniform or non-uniform fluorescence distribution. In the cells with a non-uniform distribution, the intensity in the regions with strong and weak fluorescence was scored. The values from each of four independent experiments were relativized to the WT value in regions with strong fluorescence. The percentage of cells with a uniform and non-uniform fluorescence distribution is shown at the bottom in bold blue lettering. The numbers correspond to the mean, standard deviation, and statistical significance of the differences. The statistical differences were determined using Tukey’s (fluorescence intensity) and Sidak’s (percentage of cells) multiple comparisons tests. ns, non-significant; **p < 0.01; ***p < 0.001; ****p < 0.0001. (D) Cells from the indicated strains were spotted on YES (rich medium) and YES with 0.6 M KCl, and incubated at 25 and 32°C for 5 and 3 days, respectively. (E) WT and cfr1Δ cells bearing Its3-GFP incubated with 0.6 M KCl for the indicated times (minutes) were photographed with a Deltavision system. Images are SUM projections. (F) WT and cfr1Δ cells with the PI(4,5)P2-binding probe GFP-GAP1 incubated with 0.6 M KCl for the indicated times (minutes) were photographed with a Deltavision system. Images are SUM projections. (G) Percentage of WT and cfr1Δ cells with GFP-GAP1 fluorescence at the cell periphery. Cells were incubated with 0.6 M KCl and photographed at the indicated times (minutes). For each time, the mean of four independent experiments, standard deviation, and statistical significance of the differences, determined using Sidak’s multiple comparison test, are shown (ns, non-significant; *p < 0.05; ****p < 0.0001). In (B,E,F), the scale bar corresponds to 10 μM.

