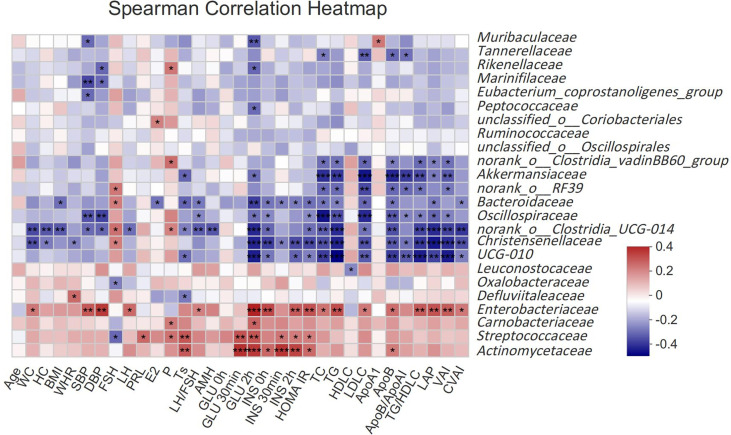
Figure 2.
Spearman correlation thermogram of clinical indicators and gut microbiota at Family level. Blue indicated a negative correlation and red indicated a positive correlation. The depth of the color represented the strength of the correlation. The deeper the color was, the stronger the correlation was. *P < 0.05, **P < 0.01, ***P < 0.001.

