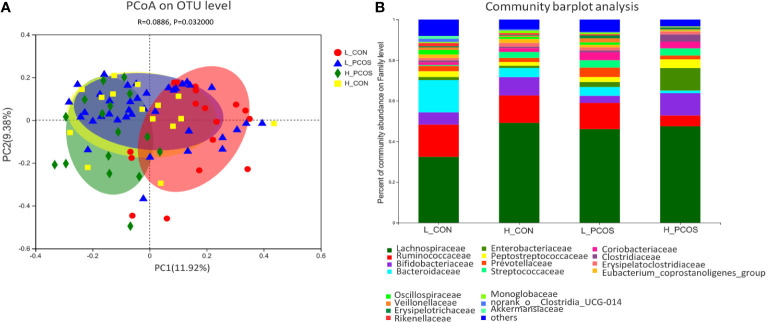
Figure 3.
Principal coordinate analysis and Community barplot analysis of the gut microbial communities. (A) Principal coordinate analysis (PCoA) of gut microbiota was based on Bray–Curtis faith distance (ANOSIM, P = 0.032, R = 0.0886). Each point represents the bacterial community composition of a single fecal sample, and the axis title represents the percentage change of interpretation (11.92% for PC1 and 9.38% for PC2). (B) Community barplot analysis at Family level in each group.

