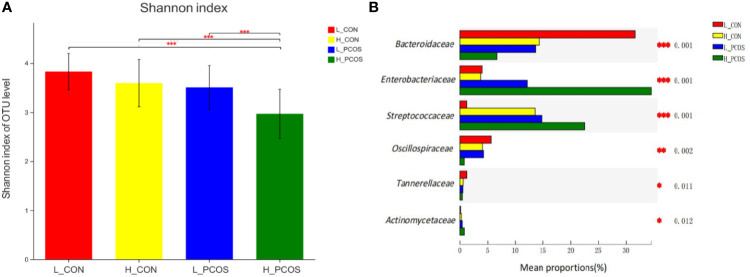
Figure 4.
Alpha diversity and Beta diversity of the gut microbial communities after adjustment for Age and BMI. (A) The Shannon index of OTU level showed the difference among the four groups. (B) Six groups of gut microbiota with statistical difference among the four groups were screened out. *P < 0.05, **P < 0.01, ***P < 0.001.

