
Figure 2.
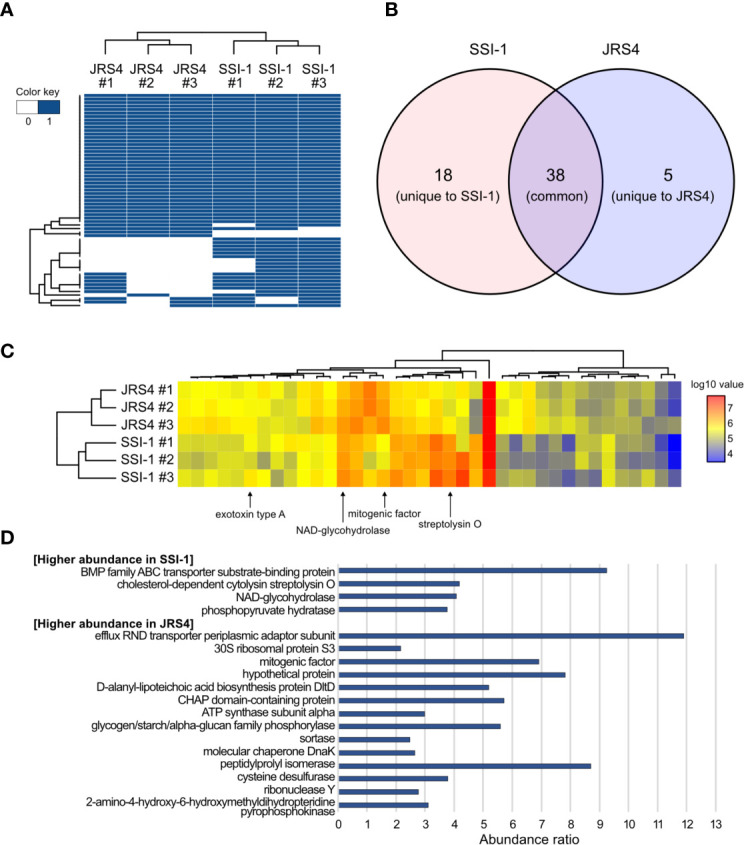
Comparison of proteome profiles of EVs from S. pyogenes str. SSI-1 and JRS4. (A) Heatmap representation of clustering according to presence and absence of proteins in EV from SSI-1 and JRS4, with biological triplicates. (B) Venn diagram of EVs-derived proteins identified in SSI-1 and JRS4. (C) Heatmap representation of clustering according to log10-transformed abundance values of common proteins identified in two strains. Arrows indicate well-known virulence factors in GAS. (D) Abundance ratio significantly higher (> 2.0) in SSI-1 or JRS4 that are shown in bar-chart. Heatmap generation was implemented in R by using heatmap.2 from ggplots package.