Fig. 1.
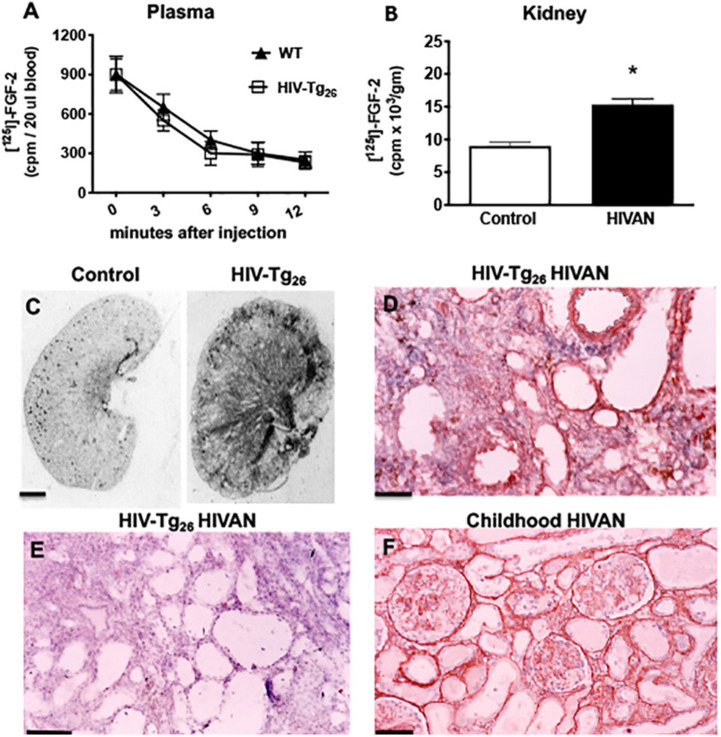
Recruitment of circulating FGF-2 in the kidney of HIV-Tg26 mice with renal disease. (A) Representative graph documenting the clearance of [125-I] FGF-2 from the blood of wild-type (WT) and HIV-Tg26 mice, 12 min after an intravenous FGF-2 injection. Bars represent the mean±s.e.m. [125-I] FGF-2 counts/min (cpm) values (n=3 mice per group). (B) Mean±s.e.m. for [125-I] FGF-2 accumulated in the kidney of WT and HIV-Tg26 mice with renal disease after an intravenous injection, as described in the Materials and Methods. *P<0.05 by the Mann–Whitney unpaired t-test (n=3 mice per group). (C) Representative autoradiographs showing the total [125-I]FGF-2 binding in the kidney of WT and HIV-Tg26 mice with renal disease (n=3 mice per group). (D) FGF-2 immunohistochemistry staining (red) in a representative renal section harvested from HIV-Tg26 mice with renal disease (n=4 samples). (E) Similar renal section harvested from an HIV-Tg26 mouse with renal disease incubated with a control non-specific IgG antibody as described in the Materials and Methods (n=3 samples). (F) Representative immunohistochemistry FGF-2 staining (red) in the kidney of a child with HIV-associated neuropathy (HIVAN) complicated by thrombotic microangiopathy (n=3 samples with HIVAN). Scale bars: 1.5 mm (C); 40 μm (D-F).

