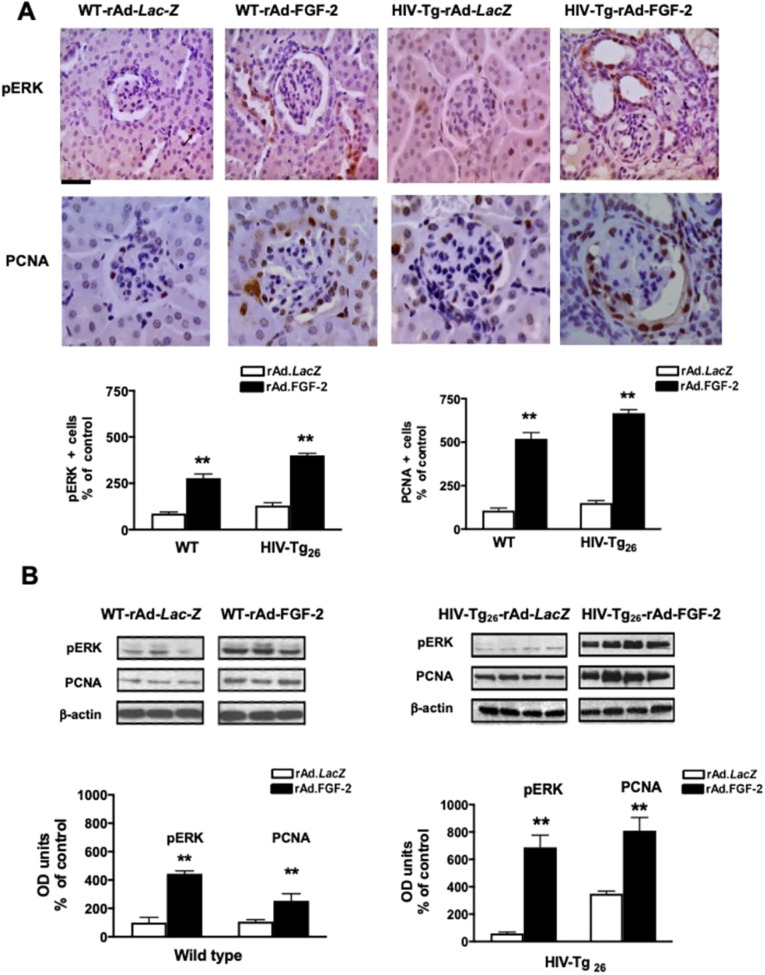
Fig. 4.
rAd-FGF-2 induced the expression of pERK and PCNA in podocytes and tubular epithelial cells. (A) Representative immunohistochemistry staining for pERK and PCNA (both brown) in renal sections harvested from WT and HIV-Tg26 mice 14 days after the corresponding adenoviral injections. The graphs represent percentage changes in the number of positive cells (mean±s.e.m.) relative to the corresponding control groups. **P<0.01, Mann–Whitney unpaired t-test (n=3-4 mice per group). Scale bar: 20 µm. (B) Representative results of the western blot analysis for pERK and PCNA performed in kidney homogenates derived from WT and HIV-Tg26 mice harvested 14 days after infection with the corresponding adenoviral vectors. The expression of pERK and PCNA was quantitated as a ratio of β-actin. The graphs show the results of the densitometry analysis and quantification of the results in optical density (OD) units (mean±s.e.m.), as described in the Materials and Methods. Statistical significance was determined using a Mann–Whitney unpaired t-test. **P<0.01, compared to WT or HIV-Tg26 mice infected with rAd-LacZ vectors (n=3-4 mice per group).

