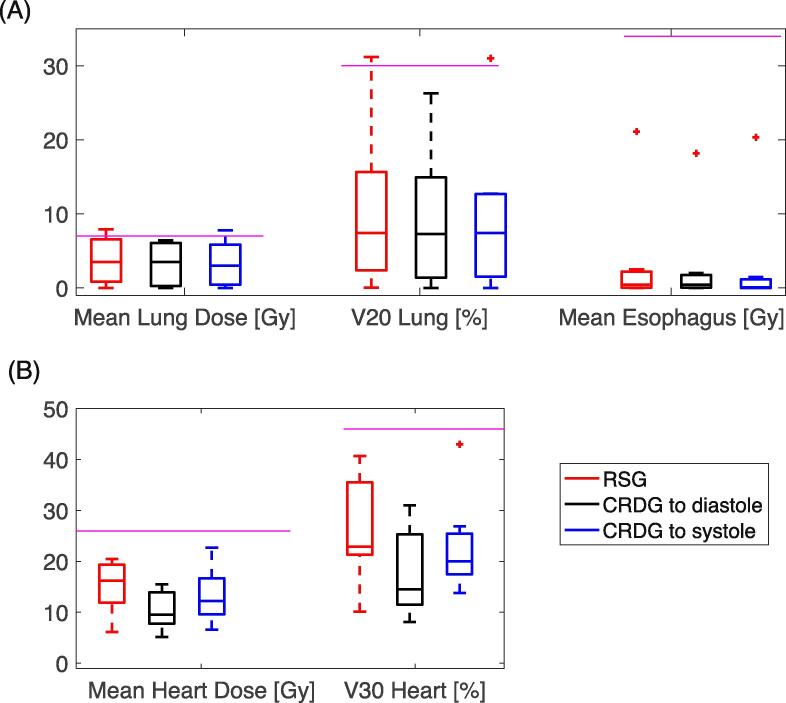
Fig. 2.
Dose metric summary (Mean Dose (A) and Volume (B)) of RSG (red) and CRDG plans (black: CRDG phase to diastole, blue: to systole). The purple lines represent the dose constraints used in planning (also shown in Supplementary Material Table 2). The box contains medians and 25th and 75th percentiles. Whiskers are for maximum and minimum and outliers are presented as a marker (+). (For interpretation of the references to colour in this figure legend, the reader is referred to the web version of this article.)

