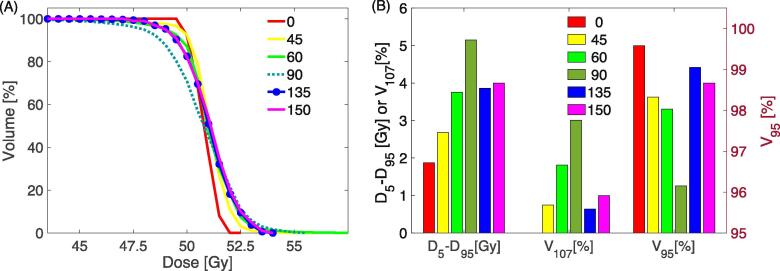
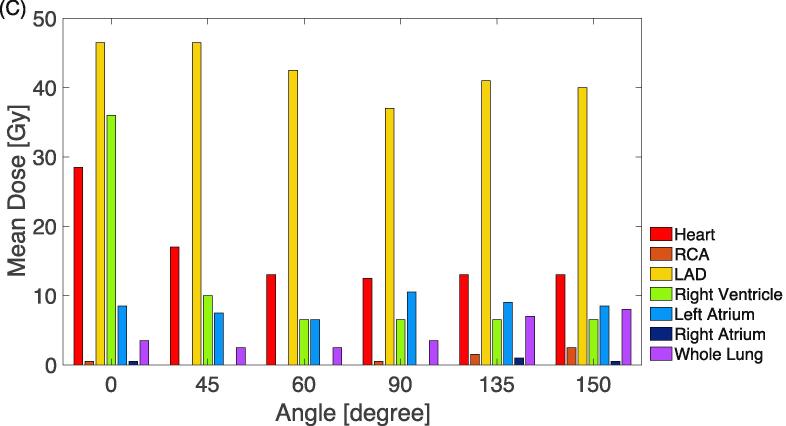
Fig. 3.
Trade-off between the beam geometries. The target (PTV) is at left ventricular free wall. (A): Target coverage in DVH. (B): dose homogeneity (D5–D95), overdose (V107) and dose coverage (V95). D5–D95 and V107 use the black label on the left y axis and V95 reads the red label on the right y axis). (C): OAR mean doses. (For interpretation of the references to colour in this figure legend, the reader is referred to the web version of this article.)


